Filing Flows › Industrials › Karman Holdings (KRMN)
Karman Holdings (KRMN) earnings and revenue breakdown
Latest: Q3 2026 · 10-Q filed Nov 6, 2026 · Karman Holdings (KRMN) Q3 2026 earnings results →
Q3 2026 Revenue up 66% year over year to $202M · 10¢ of every $1 of revenue kept as net profit · operating margin 15.7%
Karman Holdings made $202M in Q3 2026 (+66% Y/Y): Tactical Missile and Integrated Defense Systems $67.6M, Hypersonic and Strategic Missile Defense $51.1M, Maritime Defense Systems $45.0M. Operating margin 15.7%, net earnings $20.9M. See where every dollar goes — costs, profit and cash — as a Sankey from the 10-Q filed Nov 6, 2026.
Drawing the Sankey…
Open the interactive Sankey → click any line for what the company wrote about it, compare Y/Y and Q/Q, export as PNG or PDF
What changed this quarter
Revenue was $201.6M in Q3 2026, up 66% year over year and up 11% from the previous quarter. Tactical Missile and Integrated Defense Systems was the largest line at 34% of revenue. Tactical Missile and Integrated Defense Systems added $23.1M year over year (up 52%), 29% of the total change. Space and Launch declined 7%.
Gross margin was 42.7%, up 1.7 points from Q3 2025. Operating profit was $31.8M, a 15.7% margin (down 2.2 points year over year). Of the extra revenue versus Q3 2025, 12% reached operating profit, below the 18% margin then. Operating expenses grew 93% against revenue growth of 66%. The fastest-growing cost line was General & admin (+108%). Net earnings were $20.9M, up 174% year over year. The effective tax rate was -57.1%.
Operating cash flow was $26.7M (up 20303% year over year), 128% of net earnings. Non-cash charges added back $16.5M of depreciation and amortization and $1.9M of share-based compensation. Working capital and other items used $12.6M. After purchases of property and equipment ($13.4M), free cash flow as the company reports it was $13.4M.
Quarterly history
| Quarter | Form | Filed | Revenue | Y/Y | Op. margin | Net earnings | Op. cash flow |
|---|---|---|---|---|---|---|---|
| Q3 2026 | 10-Q | Nov 6, 2026 | $202M | +66% | 15.7% | $20.9M | $26.7M |
| Q2 2026 | 10-Q | Aug 11, 2026 | $182M | +58% | 19.1% | $14.0M | −$3.2M |
| Q1 2026 | 10-Q | May 14, 2026 | $151M | +51% | 14.2% | $7.8M | $209K |
| Q4 2025 | 10-K | Apr 3, 2026 | $134M | +47% | 15.7% | $7.7M | $8.7M |
| Q3 2025 | 10-Q | Nov 7, 2025 | $122M | +42% | 17.9% | $7.6M | $131K |
| Q2 2025 | 10-Q | Aug 8, 2025 | $115M | +35% | 17.5% | $6.8M | −$17.4M |
| Q1 2025 | 10-Q | May 14, 2025 | $100M | +21% | 10.0% | −$4.8M | −$13.6M |
Charts
In supply chains and themes
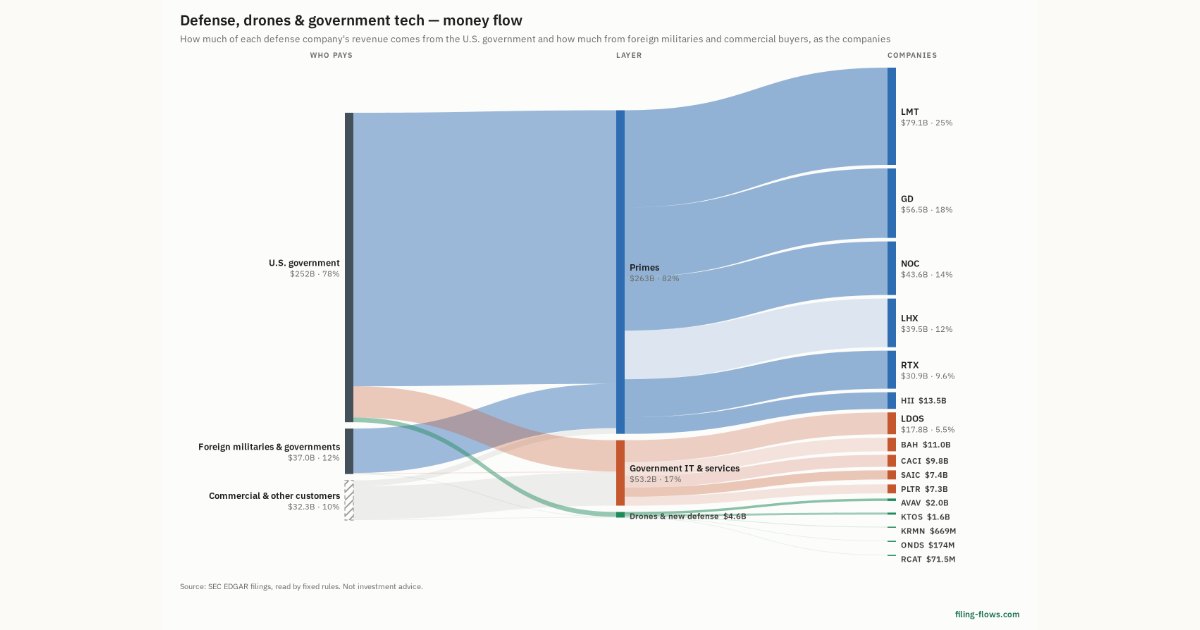
Interactive views
The same charts as the app — open one to draw it.
💵Where each $1 goesinteractive
Loading the interactive chart…
🌏Named in Asian annual reportsinteractive
Loading the interactive chart…
🔄Rotation against the market and its industry (RRG)interactive
Loading the interactive chart…
🔍Earnings qualityinteractive
Loading the interactive chart…
⚖️Fair value by methodinteractive
Loading the interactive chart…
🔭Outlook & guidanceinteractive
Loading the interactive chart…
📈Investments: gains and what it boughtinteractive
Loading the interactive chart…
🏭Its industry’s money flow (input-output)interactive
Loading the interactive chart…
About Karman Holdings
Karman Space & Defense is a leader in the rapid design, development and production of critical, next-generation system solutions that align with the U.S. Department of War and its allies’ core mission priorities and the accelerating demand for access to space . Building on nearly 50 years of success, we deliver Payload Protection Systems, Hydro/Aerodynamic Interstage Systems, and Propulsion & Launch Systems to more than 150 prime contractors and programs. Karman is headquartered in Huntington Beach, CA, with multiple facilities across the United States. For more information, visit our website, www.karman-sd.com.
In its own words, from its 8-K, filed Aug 6, 2026.
Karman Holdings against its Aircraft Parts & Auxiliary Equipment, NEC peers
The largest companies of the same SEC industry, each at its latest quarter. Revenue growth: +66% against the peers' median +27%. Operating margin: 15.7% against the peers' median 15.7%.
| Company | Quarter | Revenue | Y/Y | Op. margin |
|---|---|---|---|---|
| KRMN Karman Holdings | Q3 2026 | $202M | +66% | 15.7% |
| TDG TransDigm Group | Q3 FY26 | $2.7B | +22% | 44.8% |
| ARXS Arxis | Q3 2026 | $564M | +36% | 23.7% |
| ATRO Astronics | Q2 2026 | $260M | +27% | 15.6% |
| DCO Ducommun | Q3 2026 | $227M | +6% | 11.4% |
| LOAR Loar Holdings | Q3 2026 | $176M | +39% | 26.2% |
| AADX Applied Aerospace & Defense | Q2 2026 | $167M | +47% | -57.5% |
| PKE Park Aerospace | Q2 FY27 | $20.8M | +27% | 22.8% |
| CVU CPI Aerostructures | Q2 2026 | $17.6M | +16% | 6.8% |
Source: Karman Holdings 10-Q on SEC EDGAR · CIK 2040127 · Aircraft Parts & Auxiliary Equipment, NEC
Guidance and outlook
13F: who owns KRMN and who is buying
More on KRMN
- How Karman Holdings makes money: revenue by segment
- Karman Holdings next earnings date and what analysts expect
- Karman Holdings stock forecast, price target and fair value
- Who owns Karman Holdings stock: holders, funds and Congress trades
- Karman Holdings guidance and outlook
- Karman Holdings recalls, complaints and regulation
History
Every quarter: Q3 2026 results · Q2 2026 results · Q1 2026 results · Q4 2025 results · Q3 2025 results · Q2 2025 results · Q1 2025 results
- Karman Holdings guidance history: guided vs reported
- Karman Holdings gross margin by quarter
- Karman Holdings operating margin by quarter
- Karman Holdings net income by quarter
- Karman Holdings capital expenditures by quarter
- Karman Holdings Tactical Missile and Integrated Defense Systems revenue by quarter
- Karman Holdings Hypersonic and Strategic Missile Defense revenue by quarter
- Karman Holdings Maritime Defense Systems revenue by quarter