Filing Flows › Energy › Liberty Energy (LBRT)
Liberty Energy (LBRT) earnings and revenue breakdown
Latest: Q3 2026 · 10-Q filed Oct 22, 2026 · Liberty Energy (LBRT) Q3 2026 earnings results →
Q3 2026 Revenue up 26% year over year to $1.2B · 3¢ of every $1 of revenue lost · operating margin 1.6%
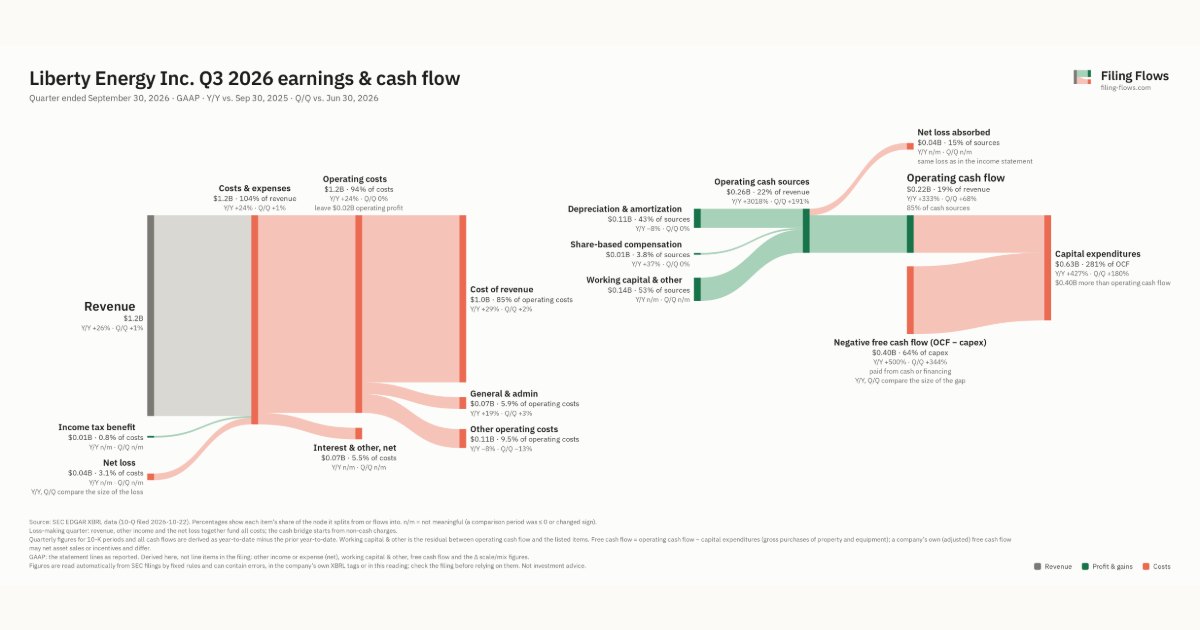
Liberty Energy made $1.2B in Q3 2026 (+26% Y/Y). Operating margin 1.6%, net loss $39.1M. See where every dollar goes — costs, profit and cash — as a Sankey from the 10-Q filed Oct 22, 2026.
Drawing the Sankey…
Open the interactive Sankey → click any line for what the company wrote about it, compare Y/Y and Q/Q, export as PNG or PDF
What changed this quarter
Revenue was $1.2B in Q3 2026, up 26% year over year and up 1% from the previous quarter.
Operating profit was $0.02B, a 1.6% margin (up 1.9 points year over year). Total costs grew 24% against revenue growth of 26%. The fastest-growing cost line was Cost of revenue (+29%). The quarter ended with a net loss of $0.04B, after a profit of $0.04B the previous quarter. Net interest and other expense of $0.07B was the main reason.
Operating cash flow was $0.22B (up 333% year over year). Non-cash charges added back $0.11B of depreciation and amortization and $0.01B of share-based compensation. Working capital and other items added $0.14B. Capital expenditures of $0.63B exceeded it, leaving free cash flow of −$0.40B.
Quarterly history
| Quarter | Form | Filed | Revenue | Y/Y | Op. margin | Net earnings | Op. cash flow |
|---|---|---|---|---|---|---|---|
| Q3 2026 | 10-Q | Oct 22, 2026 | $1.2B | +26% | 1.6% | −$39.1M | $223M |
| Q2 2026 | 10-Q | Jul 23, 2026 | $1.2B | +14% | 1.1% | $43.1M | $133M |
| Q1 2026 | 10-Q | Apr 23, 2026 | $1.0B | +4% | 2.2% | $22.6M | $8.4M |
| Q4 2025 | 10-K | Feb 2, 2026 | $1.0B | +10% | 1.9% | $13.7M | $195M |
| Q3 2025 | 10-Q | Oct 17, 2025 | $947M | -17% | -0.3% | $43.1M | $51.5M |
| Q2 2025 | 10-Q | Jul 25, 2025 | $1.0B | -10% | 3.6% | $71.0M | $171M |
| Q1 2025 | 10-Q | Apr 17, 2025 | $977M | -9% | 1.9% | $20.1M | $192M |
Charts
Interactive views
The same charts as the app — open one to draw it.
💵Where each $1 goesinteractive
Loading the interactive chart…
🌏Named in Asian annual reportsinteractive
Loading the interactive chart…
🔄Rotation against the market and its industry (RRG)interactive
Loading the interactive chart…
🔍Earnings qualityinteractive
Loading the interactive chart…
⚖️Fair value by methodinteractive
Loading the interactive chart…
🔭Outlook & guidanceinteractive
Loading the interactive chart…
📈Investments: gains and what it boughtinteractive
Loading the interactive chart…
🏭Its industry’s money flow (input-output)interactive
Loading the interactive chart…
About Liberty Energy
The Company, together with its subsidiaries, is a leading integrated energy services and technology company, and one of the largest providers of innovative completions services and related technologies to onshore oil, natural gas, and enhanced geothermal exploration and production (“E&P”) companies. We offer customers completions services, which include hydraulic fracturing together with complementary services including wireline services, proppant delivery solutions, field gas processing and treating, compressed natural gas (“CNG”) delivery, data analytics, related goods (including our sand mine operations), and technologies to facilitate lower emission completions, thereby helping our customers reduce their emissions profile.
In its own words, from its 10-K, filed Feb 2, 2026.
Liberty Energy against its Oil & Gas Field Services, NEC peers
The largest companies of the same SEC industry, each at its latest quarter. Revenue growth: +26% against the peers' median +7%. Operating margin: 1.6% against the peers' median 8.7%.
| Company | Quarter | Revenue | Y/Y | Op. margin |
|---|---|---|---|---|
| LBRT Liberty Energy | Q3 2026 | $1.2B | +26% | 1.6% |
| SLB SLB Limited | Q3 2026 | $9.4B | +6% | 10.8% |
| HAL Halliburton | Q3 2026 | $5.7B | +2% | 10.9% |
| OII Oceaneering International | Q3 2026 | $785M | +6% | 11.7% |
| NESR National Energy Services Reunited | Q2 2026 | $521M | +59% | 12.5% |
| ACDC ProFrac Holding | Q3 2026 | $511M | +27% | -6.7% |
| RES RPC | Q3 2026 | $468M | +5% | -11.5% |
| XPRO Expro | Q3 2026 | $440M | +7% | 1.1% |
| WTTR Select Water Solutions | Q2 2026 | $396M | +9% | 8.7% |
Source: Liberty Energy 10-Q on SEC EDGAR · CIK 1694028 · Oil & Gas Field Services, NEC
13F: who owns LBRT and who is buying
More on LBRT
History
Every quarter: Q3 2026 results · Q2 2026 results · Q1 2026 results · Q4 2025 results · Q3 2025 results · Q2 2025 results · Q1 2025 results