Filing Flows › Consumer Discretionary › Las Vegas Sands (LVS)
Las Vegas Sands (LVS) earnings and revenue breakdown
Latest: Q3 2026 · 10-Q filed Oct 23, 2026 · Las Vegas Sands (LVS) Q3 2026 earnings results →
Q3 2026 Revenue down 4% year over year to $3.2B · 9¢ of every $1 of revenue kept as net profit · operating margin 19.2%
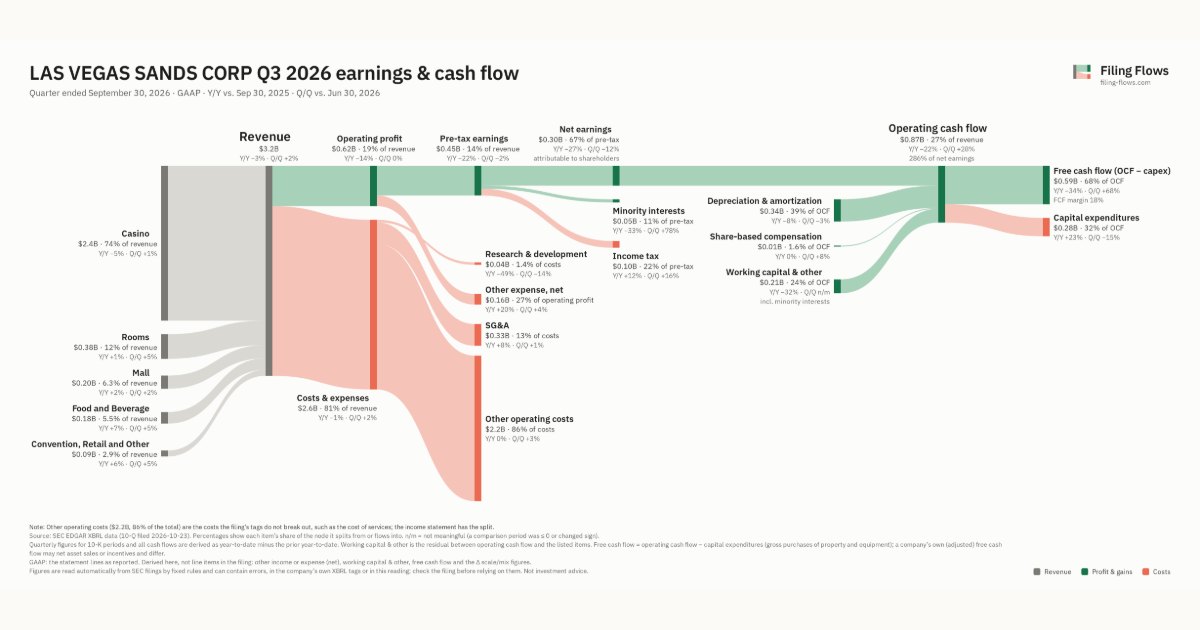
Las Vegas Sands made $3.2B in Q3 2026 (-4% Y/Y): Casino $2.4B, Rooms $376M, Mall $202M. Operating margin 19.2%, net earnings $304M. See where every dollar goes — costs, profit and cash — as a Sankey from the 10-Q filed Oct 23, 2026.
Drawing the Sankey…
Open the interactive Sankey → click any line for what the company wrote about it, compare Y/Y and Q/Q, export as PNG or PDF
What changed this quarter
Revenue was $3.2B in Q3 2026, down 3% year over year and up 2% from the previous quarter. Casino was the largest line at 74% of revenue. Casino lost $0.14B year over year (down 5%), 118% of the total change.
Operating profit was $0.62B, a 19.2% margin (down 2.4 points year over year). Total costs fell 1% while revenue fell 3%. Net earnings were $0.30B, down 27% year over year. The effective tax rate was 22.5%.
Operating cash flow was $0.87B (down 22% year over year), 247% of net income including minority interests. Non-cash charges added back $0.34B of depreciation and amortization and $0.01B of share-based compensation. Working capital and other items added $0.16B. Capital expenditures of $0.28B left free cash flow of $0.59B.
Quarterly history
| Quarter | Form | Filed | Revenue | Y/Y | Op. margin | Net earnings | Op. cash flow |
|---|---|---|---|---|---|---|---|
| Q3 2026 | 10-Q | Oct 23, 2026 | $3.2B | -4% | 19.2% | $304M | $870M |
| Q2 2026 | 10-Q | Jul 24, 2026 | $3.2B | -0.7% | 19.6% | $346M | $682M |
| Q1 2026 | 10-Q | Apr 24, 2026 | $3.6B | +25% | 25.2% | $567M | $731M |
| Q4 2025 | 10-K | Feb 6, 2026 | $3.6B | +26% | 19.4% | $395M | $1.2B |
| Q3 2025 | 10-Q | Oct 24, 2025 | $3.3B | +24% | 21.6% | $419M | $1.1B |
| Q2 2025 | 10-Q | Jul 25, 2025 | $3.2B | +15% | 24.7% | $461M | $178M |
| Q1 2025 | 10-Q | Apr 25, 2025 | $2.9B | -3% | 21.3% | $352M | $526M |
Charts
Interactive views
The same charts as the app — open one to draw it.
💵Where each $1 goesinteractive
Loading the interactive chart…
🌏Named in Asian annual reportsinteractive
Loading the interactive chart…
🔄Rotation against the market and its industry (RRG)interactive
Loading the interactive chart…
🔍Earnings qualityinteractive
Loading the interactive chart…
⚖️Fair value by methodinteractive
Loading the interactive chart…
🔭Outlook & guidanceinteractive
Loading the interactive chart…
📈Investments: gains and what it boughtinteractive
Loading the interactive chart…
🏭Its industry’s money flow (input-output)interactive
Loading the interactive chart…
About Las Vegas Sands
Las Vegas Sands Corp. (“LVSC,” or together with its subsidiaries “we” or the “Company”) is a Fortune 500 company and the leading global developer and operator of destination properties (“Integrated Resorts”) that feature premium accommodations, world-class gaming, entertainment and retail malls, convention and exhibition facilities, celebrity chef restaurants and other amenities. We currently own and operate Integrated Resorts in Macao and Singapore. We believe our geographic diversity, best-in-class properties and meeting and convention facilities provide us with the best platform in the hospitality and gaming industry to attract leisure and business tourism to our markets and continue generating growth and cash flow while simultaneously pursuing new development opportunities.
In its own words, from its 10-K, filed Feb 6, 2026.
Las Vegas Sands against its Hotels & Motels peers
The largest companies of the same SEC industry, each at its latest quarter. Revenue growth: -4% against the peers' median +2%. Operating margin: 19.2% against the peers' median 15.5%.
| Company | Quarter | Revenue | Y/Y | Op. margin |
|---|---|---|---|---|
| LVS Las Vegas Sands | Q3 2026 | $3.2B | -4% | 19.2% |
| MAR Marriott International | Q3 2026 | $7.0B | +8% | 18.2% |
| MGM MGM Resorts International | Q3 2026 | $4.2B | -0.9% | 2.8% |
| HLT Hilton Worldwide Holdings | Q3 2026 | $3.3B | +7% | 27.3% |
| CZR Caesars Entertainment | Q3 2026 | $2.9B | +2% | 15.5% |
| PENN Penn Entertainment | Q3 2026 | $1.8B | +7% | 6.9% |
| H Hyatt Hotels | Q3 2026 | $1.7B | -2% | 4.5% |
| WYNN Wynn Resorts | Q3 2026 | $1.7B | -8% | 10.6% |
| TNL Travel & Leisure | Q3 2026 | $1.1B | +6% | 17.7% |
Source: Las Vegas Sands 10-Q on SEC EDGAR · CIK 1300514 · Hotels & Motels
13F: who owns LVS and who is buying
More on LVS
History
Every quarter: Q3 2026 results · Q2 2026 results · Q1 2026 results · Q4 2025 results · Q3 2025 results · Q2 2025 results · Q1 2025 results
- Las Vegas Sands operating margin by quarter
- Las Vegas Sands net income by quarter
- Las Vegas Sands free cash flow by quarter
- Las Vegas Sands R&D spending by quarter
- Las Vegas Sands capital expenditures by quarter
- Las Vegas Sands Casino revenue by quarter
- Las Vegas Sands Rooms revenue by quarter
- Las Vegas Sands Mall revenue by quarter