Filing Flows › Consumer Discretionary › Marriott International (MAR)
Marriott International (MAR) earnings and revenue breakdown
Latest: Q3 2026 · 10-Q filed Nov 2, 2026 · Marriott International (MAR) Q3 2026 earnings results →
Q3 2026 Revenue up 8% year over year to $7.0B · 11¢ of every $1 of revenue kept as net profit · operating margin 18.2%
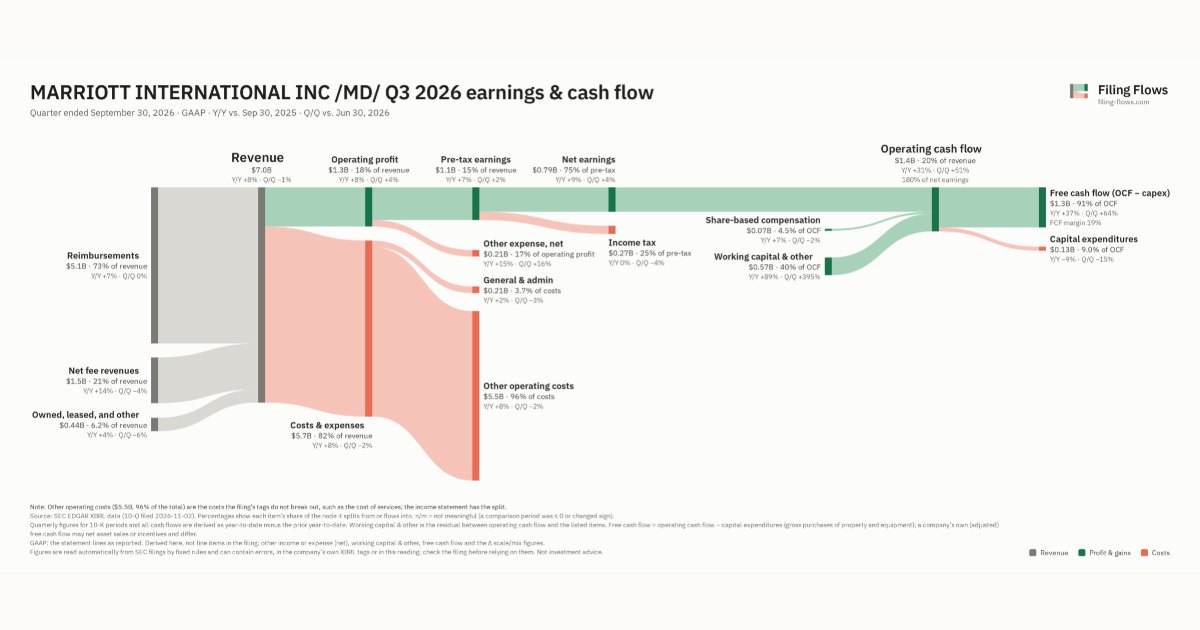
Marriott International made $7.0B in Q3 2026 (+8% Y/Y): Reimbursements $5.1B, Net fee revenues $1.5B, Owned, leased, and other $436M. Operating margin 18.2%, net earnings $794M. See where every dollar goes — costs, profit and cash — as a Sankey from the 10-Q filed Nov 2, 2026.
Drawing the Sankey…
Open the interactive Sankey → click any line for what the company wrote about it, compare Y/Y and Q/Q, export as PNG or PDF
What changed this quarter
Revenue was $7.0B in Q3 2026, up 8% year over year and down 1% from the previous quarter. Reimbursements was the largest line at 73% of revenue. Reimbursements added $0.32B year over year (up 7%), 62% of the total change.
Operating profit was $1.3B, a 18.2% margin (unchanged year over year). Of the extra revenue versus Q3 2025, 18% reached operating profit, above the 18% margin then. Total costs grew 8% against revenue growth of 8%. Net earnings were $0.79B, up 9% year over year. The effective tax rate was 25.1%.
Operating cash flow was $1.4B (up 31% year over year), 180% of net earnings. Non-cash charges added back $0.07B of share-based compensation. Working capital and other items added $0.57B. Capital expenditures of $0.13B left free cash flow of $1.3B.
Quarterly history
| Quarter | Form | Filed | Revenue | Y/Y | Op. margin | Net earnings | Op. cash flow |
|---|---|---|---|---|---|---|---|
| Q3 2026 | 10-Q | Nov 2, 2026 | $7.0B | +8% | 18.2% | $794M | $1.4B |
| Q2 2026 | 10-Q | Aug 3, 2026 | $7.1B | +5% | 17.4% | $766M | $948M |
| Q1 2026 | 10-Q | May 6, 2026 | $6.7B | +6% | 16.0% | $648M | $858M |
| Q4 2025 | 10-K | Feb 10, 2026 | $6.7B | +4% | 11.6% | $445M | $829M |
| Q3 2025 | 10-Q | Nov 4, 2025 | $6.5B | +4% | 18.2% | $728M | $1.1B |
| Q2 2025 | 10-Q | Aug 5, 2025 | $6.7B | +5% | 18.3% | $763M | $643M |
| Q1 2025 | 10-Q | May 6, 2025 | $6.3B | +5% | 15.1% | $665M | $647M |
Charts
Interactive views
The same charts as the app — open one to draw it.
💵Where each $1 goesinteractive
Loading the interactive chart…
🌏Named in Asian annual reportsinteractive
Loading the interactive chart…
🔄Rotation against the market and its industry (RRG)interactive
Loading the interactive chart…
🔍Earnings qualityinteractive
Loading the interactive chart…
⚖️Fair value by methodinteractive
Loading the interactive chart…
🔭Outlook & guidanceinteractive
Loading the interactive chart…
📈Investments: gains and what it boughtinteractive
Loading the interactive chart…
🏭Its industry’s money flow (input-output)interactive
Loading the interactive chart…
About Marriott International
We are a worldwide franchisor, operator, and licensor of hotel, residential, timeshare, and other lodging properties under a portfolio of compelling brands at different price and service points. Consistent with our focus on franchising, management, and licensing, we own or lease very few of our lodging properties (less than one percent of our system). As of year-end 2025, our system included 9,805 properties (1,779,936 rooms) in 145 countries and territories, and we also had approximately 4,100 properties (nearly 610,000 rooms) in our development pipeline.
In its own words, from its 10-K, filed Feb 10, 2026.
Marriott International against its Hotels & Motels peers
The largest companies of the same SEC industry, each at its latest quarter. Revenue growth: +8% against the peers' median +2%. Operating margin: 18.2% against the peers' median 15.5%.
| Company | Quarter | Revenue | Y/Y | Op. margin |
|---|---|---|---|---|
| MAR Marriott International | Q3 2026 | $7.0B | +8% | 18.2% |
| MGM MGM Resorts International | Q3 2026 | $4.2B | -0.9% | 2.8% |
| HLT Hilton Worldwide Holdings | Q3 2026 | $3.3B | +7% | 27.3% |
| LVS Las Vegas Sands | Q3 2026 | $3.2B | -4% | 19.2% |
| CZR Caesars Entertainment | Q3 2026 | $2.9B | +2% | 15.5% |
| PENN Penn Entertainment | Q3 2026 | $1.8B | +7% | 6.9% |
| H Hyatt Hotels | Q3 2026 | $1.7B | -2% | 4.5% |
| WYNN Wynn Resorts | Q3 2026 | $1.7B | -8% | 10.6% |
| TNL Travel & Leisure | Q3 2026 | $1.1B | +6% | 17.7% |
Source: Marriott International 10-Q on SEC EDGAR · CIK 1048286 · Hotels & Motels
Guidance and outlook
13F: who owns MAR and who is buying
More on MAR
- How Marriott International makes money: revenue by segment
- Marriott International next earnings date and what analysts expect
- Marriott International stock forecast, price target and fair value
- Who owns Marriott International stock: holders, funds and Congress trades
- Marriott International guidance and outlook
History
Every quarter: Q3 2026 results · Q2 2026 results · Q1 2026 results · Q4 2025 results · Q3 2025 results · Q2 2025 results · Q1 2025 results
- Marriott International guidance history: guided vs reported
- Marriott International operating margin by quarter
- Marriott International net income by quarter
- Marriott International free cash flow by quarter
- Marriott International capital expenditures by quarter
- Marriott International Reimbursements revenue by quarter
- Marriott International Net fee revenues revenue by quarter
- Marriott International Owned, leased, and other revenue by quarter