Filing Flows › Industrials › Masco (MAS)
Masco (MAS) earnings and revenue breakdown
Latest: Q3 2026 · 10-Q filed Oct 28, 2026 · Masco (MAS) Q3 2026 earnings results →
Q3 2026 Revenue up 3% year over year to $2.0B · 12¢ of every $1 of revenue kept as net profit · operating margin 17.2%
Masco made $2.0B in Q3 2026 (+3% Y/Y): Plumbing Products $1.3B, Decorative Architectural Products $628M. Operating margin 17.2%, net earnings $230M. See where every dollar goes — costs, profit and cash — as a Sankey from the 10-Q filed Oct 28, 2026.
Drawing the Sankey…
Open the interactive Sankey → click any line for what the company wrote about it, compare Y/Y and Q/Q, export as PNG or PDF
What changed this quarter
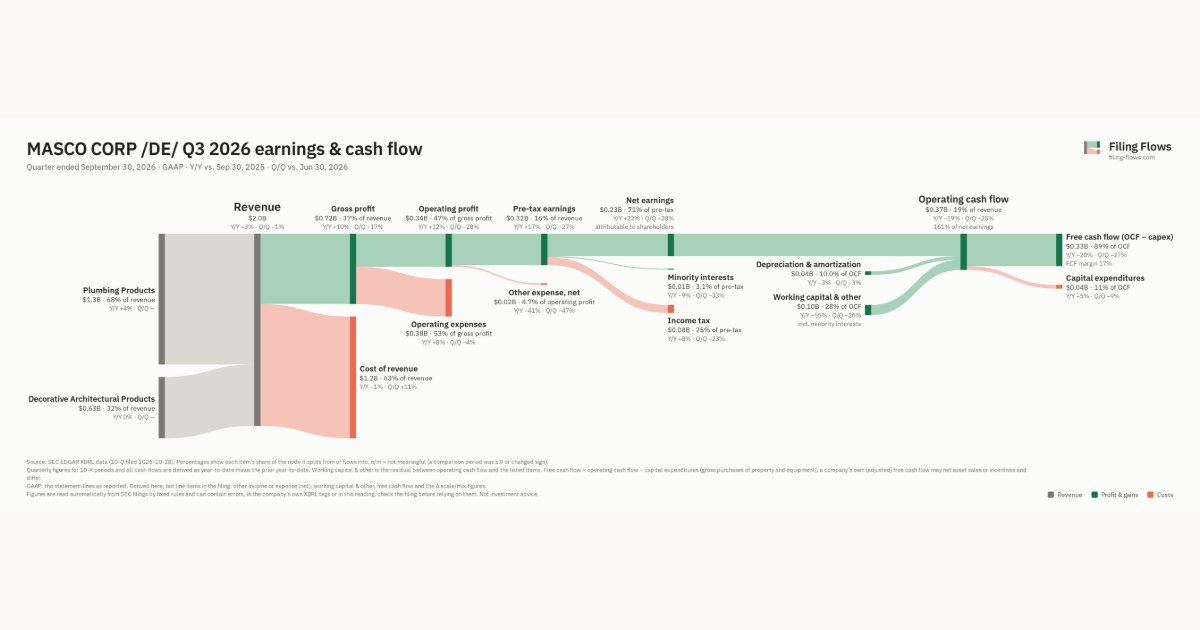
Revenue was $2.0B in Q3 2026, up 3% year over year and down 1% from the previous quarter. Plumbing Products was the largest line at 68% of revenue. Plumbing Products added $0.05B year over year (up 4%), 98% of the total change.
Gross margin was 36.6%, up 2.4 points from Q3 2025. Operating profit was $0.34B, a 17.2% margin (up 1.4 points year over year). Of the extra revenue versus Q3 2025, 71% reached operating profit, above the 16% margin then. Operating expenses grew 8% against revenue growth of 3%. Net earnings were $0.23B, up 22% year over year. The effective tax rate was 25.5%.
Operating cash flow was $0.37B (down 19% year over year), 155% of net income including minority interests. Non-cash charges added back $0.04B of depreciation and amortization. Working capital and other items added $0.09B. Capital expenditures of $0.04B left free cash flow of $0.33B.
Quarterly history
| Quarter | Form | Filed | Revenue | Y/Y | Op. margin | Net earnings | Op. cash flow |
|---|---|---|---|---|---|---|---|
| Q3 2026 | 10-Q | Oct 28, 2026 | $2.0B | +3% | 17.2% | $230M | $371M |
| Q2 2026 | 10-Q | Jul 29, 2026 | $2.0B | -3% | 23.6% | $318M | $496M |
| Q1 2026 | 10-Q | Apr 22, 2026 | $1.9B | +6% | 16.5% | $213M | −$79.0M |
| Q4 2025 | 10-K | Feb 10, 2026 | $1.8B | -2% | 13.8% | $165M | $418M |
| Q3 2025 | 10-Q | Oct 29, 2025 | $1.9B | -3% | 15.8% | $189M | $456M |
| Q2 2025 | 10-Q | Jul 31, 2025 | $2.1B | -2% | 20.1% | $270M | $306M |
| Q1 2025 | 10-Q | Apr 23, 2025 | $1.8B | -6% | 15.9% | $186M | −$158M |
Charts
Interactive views
The same charts as the app — open one to draw it.
💵Where each $1 goesinteractive
Loading the interactive chart…
🌏Named in Asian annual reportsinteractive
Loading the interactive chart…
🔄Rotation against the market and its industry (RRG)interactive
Loading the interactive chart…
🔍Earnings qualityinteractive
Loading the interactive chart…
⚖️Fair value by methodinteractive
Loading the interactive chart…
🔭Outlook & guidanceinteractive
Loading the interactive chart…
📈Investments: gains and what it boughtinteractive
Loading the interactive chart…
🏭Its industry’s money flow (input-output)interactive
Loading the interactive chart…
About Masco
Masco Corporation and its subsidiaries (the “Company”) is a global leader in the design, manufacture and distribution of branded home improvement and building products. Our portfolio of industry-leading brands includes BEHR® paint; DELTA® and HANSGROHE® faucets, bath and shower fixtures; LIBERTY® branded decorative and functional hardware; and HOT SPRING® spas. We leverage our powerful brands across product categories, sales channels and geographies to create value for our customers and shareholders. We believe that our solid results of operations and financial position for 2025 resulted from our continued focus on our strategy to drive the full potential of our core businesses, leverage opportunities across our enterprise, and actively manage our portfolio.
In its own words, from its 10-K, filed Feb 10, 2026.
Masco against its Heating Equip, Except Elec & Warm Air; & Plumbing Fixtures peers
The largest companies of the same SEC industry, each at its latest quarter. Revenue growth: +3% against the peers' median +3%. Operating margin: 17.2% against the peers' median 10.0%.
| Company | Quarter | Revenue | Y/Y | Op. margin |
|---|---|---|---|---|
| MAS Masco | Q3 2026 | $2.0B | +3% | 17.2% |
| FGI FGI Industries | Q2 2026 | $31.9M | +3% | 4.4% |
| OFLX Omega Flex | Q3 2026 | $25.7M | +6% | 10.0% |
Source: Masco 10-Q on SEC EDGAR · CIK 62996 · Heating Equip, Except Elec & Warm Air; & Plumbing Fixtures
13F: who owns MAS and who is buying
More on MAS
- How Masco makes money: revenue by segment
- Masco next earnings date and what analysts expect
- Masco stock forecast, price target and fair value
- Who owns Masco stock: holders, funds and Congress trades
- Masco guidance and outlook
- Is Masco a takeover target? LBO and rumors
- Masco recalls, complaints and regulation
History
Every quarter: Q3 2026 results · Q2 2026 results · Q1 2026 results · Q4 2025 results · Q3 2025 results · Q2 2025 results · Q1 2025 results