Filing Flows › Industrials › Moody's (MCO)
Moody's (MCO) earnings and revenue breakdown
Latest: Q3 2026 · 10-Q filed Oct 21, 2026 · Moody's (MCO) Q3 2026 earnings results →
Q3 2026 Revenue up 1% year over year to $2.0B · 36¢ of every $1 of revenue kept as net profit · operating margin 44.8%
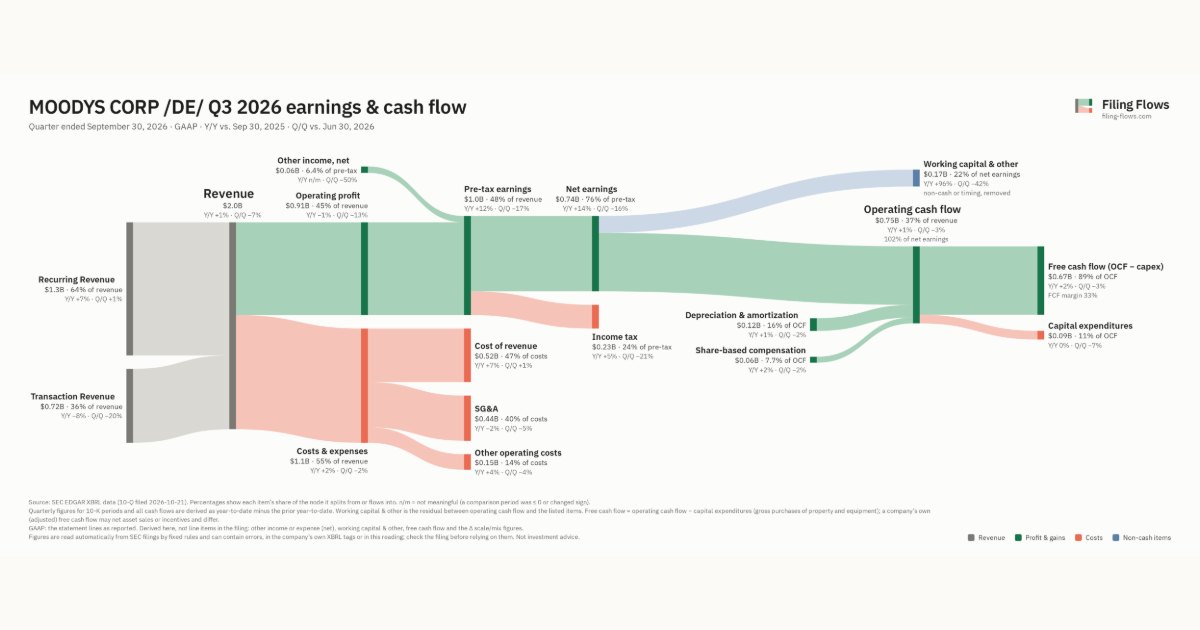
Moody's made $2.0B in Q3 2026 (+0.8% Y/Y): Recurring Revenue $1.3B, Transaction Revenue $722M. Operating margin 44.8%, net earnings $736M. See where every dollar goes — costs, profit and cash — as a Sankey from the 10-Q filed Oct 21, 2026.
Drawing the Sankey…
Open the interactive Sankey → click any line for what the company wrote about it, compare Y/Y and Q/Q, export as PNG or PDF
What changed this quarter
Revenue was $2.0B in Q3 2026, up 1% year over year and down 7% from the previous quarter. Recurring Revenue was the largest line at 64% of revenue. Recurring Revenue added $0.08B year over year (up 7%), 506% of the total change. Transaction Revenue declined 8%.
Operating profit was $0.91B, a 44.8% margin (down 0.9 points year over year). Operating profit fell $0.01B even though revenue rose $0.02B versus Q3 2025, so costs grew faster than sales. Total costs grew 2% against revenue growth of 1%. Net earnings were $0.73B, up 14% year over year. The effective tax rate was 24.0%.
Operating cash flow was $0.75B (up 1% year over year), 102% of net earnings. Non-cash charges added back $0.12B of depreciation and amortization and $0.06B of share-based compensation. Working capital and other items used $0.17B. Capital expenditures of $0.09B left free cash flow of $0.67B.
Quarterly history
| Quarter | Form | Filed | Revenue | Y/Y | Op. margin | Net earnings | Op. cash flow |
|---|---|---|---|---|---|---|---|
| Q3 2026 | 10-Q | Oct 21, 2026 | $2.0B | +0.8% | 44.8% | $736M | $753M |
| Q2 2026 | 10-Q | Jul 23, 2026 | $2.2B | +15% | 47.9% | $879M | $779M |
| Q1 2026 | 10-Q | Apr 23, 2026 | $2.1B | +8% | 44.3% | $661M | $939M |
| Q4 2025 | 10-K | Feb 18, 2026 | $1.9B | +13% | 40.8% | $611M | $858M |
| Q3 2025 | 10-Q | Oct 23, 2025 | $2.0B | +11% | 45.7% | $647M | $743M |
| Q2 2025 | 10-Q | Jul 24, 2025 | $1.9B | +4% | 43.1% | $579M | $543M |
| Q1 2025 | 10-Q | Apr 23, 2025 | $1.9B | +8% | 44.0% | $625M | $757M |
Charts
Interactive views
The same charts as the app — open one to draw it.
💵Where each $1 goesinteractive
Loading the interactive chart…
🌏Named in Asian annual reportsinteractive
Loading the interactive chart…
🔄Rotation against the market and its industry (RRG)interactive
Loading the interactive chart…
🔍Earnings qualityinteractive
Loading the interactive chart…
⚖️Fair value by methodinteractive
Loading the interactive chart…
🔭Outlook & guidanceinteractive
Loading the interactive chart…
📈Investments: gains and what it boughtinteractive
Loading the interactive chart…
🏭Its industry’s money flow (input-output)interactive
Loading the interactive chart…
About Moody's
As used in this report, except where the context indicates otherwise, the terms “Moody’s” or the “Company” refer to Moody’s Corporation, a Delaware corporation, and its subsidiaries. The Company’s executive offices are located at 7 World Trade Center at 250 Greenwich Street, New York, NY 10007 and its telephone number is (212) 553-0300. In a world shaped by increasingly interconnected risks, Moody's data, insights, and innovative technologies help customers develop a holistic view of their world and unlock opportunities. Moody’s offerings are distinguished by our vast proprietary and curated data and validated analytical models, which provide the trusted foundation that enable our customers to navigate an increasingly complex risk landscape. Moody’s solutions enable the transformation of information into decision-grade intelligence, which is deeply interconnected across risk domains.
In its own words, from its 10-K, filed Feb 18, 2026.
Moody's against its Services-Consumer Credit Reporting, Collection Agencies peers
The largest companies of the same SEC industry, each at its latest quarter. Revenue growth: +0.8% against the peers' median +7%. Operating margin: 44.8% against the peers' median 21.0%.
| Company | Quarter | Revenue | Y/Y | Op. margin |
|---|---|---|---|---|
| MCO Moody's | Q3 2026 | $2.0B | +0.8% | 44.8% |
| SPGI S&P Global | Q3 2026 | $3.7B | +7% | 53.2% |
| EFX Equifax | Q3 2026 | $1.7B | +10% | 21.0% |
| TRU TransUnion | Q3 2026 | $1.3B | +12% | 20.4% |
| CRMZ Creditriskmonitor | Q2 2026 | $5.2M | +2% | -12.9% |
Source: Moody's 10-Q on SEC EDGAR · CIK 1059556 · Services-Consumer Credit Reporting, Collection Agencies
13F: who owns MCO and who is buying
More on MCO
History
Every quarter: Q3 2026 results · Q2 2026 results · Q1 2026 results · Q4 2025 results · Q3 2025 results · Q2 2025 results · Q1 2025 results