Filing Flows › Industrials › S&P Global (SPGI)
S&P Global (SPGI) earnings and revenue breakdown
Latest: Q3 2026 · 10-Q filed Oct 28, 2026 · S&P Global (SPGI) Q3 2026 earnings results →
Q3 2026 Revenue up 7% year over year to $3.7B · 34¢ of every $1 of revenue kept as net profit · operating margin 53.2%
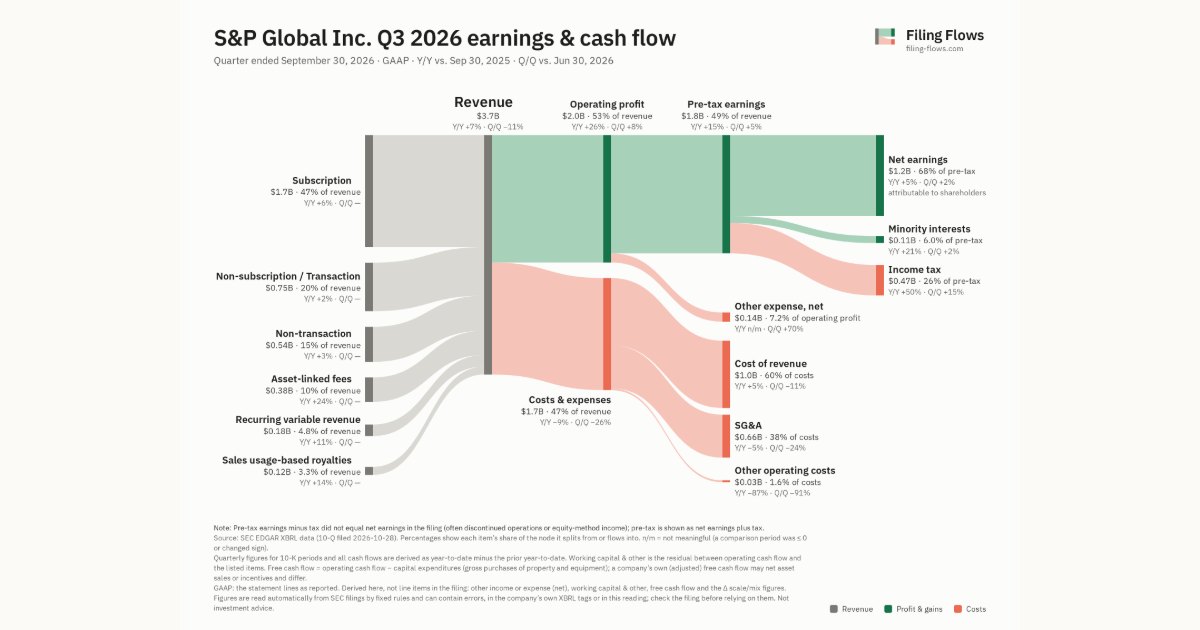
S&P Global made $3.7B in Q3 2026 (+7% Y/Y): Subscription $1.7B, Non-subscription / Transaction $746M, Non-transaction $539M. Operating margin 53.2%, net earnings $1.2B. See where every dollar goes — costs, profit and cash — as a Sankey from the 10-Q filed Oct 28, 2026.
Drawing the Sankey…
Open the interactive Sankey → click any line for what the company wrote about it, compare Y/Y and Q/Q, export as PNG or PDF
What changed this quarter
Revenue was $3.7B in Q3 2026, up 7% year over year and down 11% from the previous quarter. Subscription was the largest line at 47% of revenue. Subscription added $0.10B year over year (up 6%), 40% of the total change.
Operating profit was $2.0B, a 53.2% margin (up 8.0 points year over year). Of the extra revenue versus Q3 2025, 170% reached operating profit, above the 45% margin then. Total costs fell 9% while revenue rose 7%. Net earnings were $1.2B, up 5% year over year. The effective tax rate was 25.7%.
Quarterly history
| Quarter | Form | Filed | Revenue | Y/Y | Op. margin | Net earnings | Op. cash flow |
|---|---|---|---|---|---|---|---|
| Q3 2026 | 10-Q | Oct 28, 2026 | $3.7B | +7% | 53.2% | $1.2B | — |
| Q2 2026 | 10-Q | Jul 28, 2026 | $4.1B | +10% | 43.7% | $1.2B | $1.4B |
| Q1 2026 | 10-Q | Apr 28, 2026 | $4.2B | +10% | 48.0% | $1.4B | $1.0B |
| Q4 2025 | 10-K | Feb 11, 2026 | $3.9B | +9% | 42.7% | $1.1B | $1.7B |
| Q3 2025 | 10-Q | Oct 30, 2025 | $3.9B | +9% | 43.1% | $1.2B | $1.5B |
| Q2 2025 | 10-Q | Aug 1, 2025 | $3.8B | +6% | 41.3% | $1.1B | $1.4B |
| Q1 2025 | 10-Q | Apr 29, 2025 | $3.8B | +8% | 41.8% | $1.1B | $953M |
Charts
Interactive views
The same charts as the app — open one to draw it.
💵Where each $1 goesinteractive
Loading the interactive chart…
🌏Named in Asian annual reportsinteractive
Loading the interactive chart…
🔄Rotation against the market and its industry (RRG)interactive
Loading the interactive chart…
🔍Earnings qualityinteractive
Loading the interactive chart…
⚖️Fair value by methodinteractive
Loading the interactive chart…
🔭Outlook & guidanceinteractive
Loading the interactive chart…
📈Investments: gains and what it boughtinteractive
Loading the interactive chart…
🏭Its industry’s money flow (input-output)interactive
Loading the interactive chart…
Customers and suppliers named in filings
Sells to
- UVE · Stated in 10-K (named, share not stated) · source
- GNTX · Stated in 10-K (named, share not stated) · source
- ALV · Stated in 10-K (named, share not stated) · source
About S&P Global
S&P Global Inc. (together with its consolidated subsidiaries, “S&P Global,” the “Company,” the “Registrant,” “we,” “us” or “our”) is a global, diversified, and highly differentiated provider of benchmarks, data, analytics and workflow solutions in the global capital, energy and commodity, and automotive markets. The capital markets include asset managers, investment banks, commercial banks, insurance companies, exchanges, trading firms and issuers; the energy and commodity markets include producers, consumers, traders and intermediaries within energy, chemicals, shipping, metals, carbon and agriculture; and the automotive markets include manufacturers, suppliers, dealerships, service shops and customers. We serve our global customers through a broad range of products and services available through both third-party and proprietary distribution channels.
In its own words, from its 10-K, filed Feb 11, 2026.
S&P Global against its Services-Consumer Credit Reporting, Collection Agencies peers
The largest companies of the same SEC industry, each at its latest quarter. Revenue growth: +7% against the peers' median +7%. Operating margin: 53.2% against the peers' median 21.0%.
| Company | Quarter | Revenue | Y/Y | Op. margin |
|---|---|---|---|---|
| SPGI S&P Global | Q3 2026 | $3.7B | +7% | 53.2% |
| MCO Moody's | Q3 2026 | $2.0B | +0.8% | 44.8% |
| EFX Equifax | Q3 2026 | $1.7B | +10% | 21.0% |
| TRU TransUnion | Q3 2026 | $1.3B | +12% | 20.4% |
| CRMZ Creditriskmonitor | Q2 2026 | $5.2M | +2% | -12.9% |
Source: S&P Global 10-Q on SEC EDGAR · CIK 64040 · Services-Consumer Credit Reporting, Collection Agencies
Guidance and outlook
13F: who owns SPGI and who is buying
More on SPGI
History
Every quarter: Q3 2026 results · Q2 2026 results · Q1 2026 results · Q4 2025 results · Q3 2025 results · Q2 2025 results · Q1 2025 results
- S&P Global guidance history: guided vs reported
- S&P Global operating margin by quarter
- S&P Global net income by quarter
- S&P Global free cash flow by quarter
- S&P Global Subscription revenue by quarter
- S&P Global Non-subscription / Transaction revenue by quarter
- S&P Global Non-transaction revenue by quarter