Filing Flows › Health Care › Medtronic (MDT)
Medtronic (MDT) earnings and revenue breakdown
Latest: Q1 FY27 · 10-Q filed Sep 3, 2026 · Medtronic (MDT) Q1 FY27 earnings results →
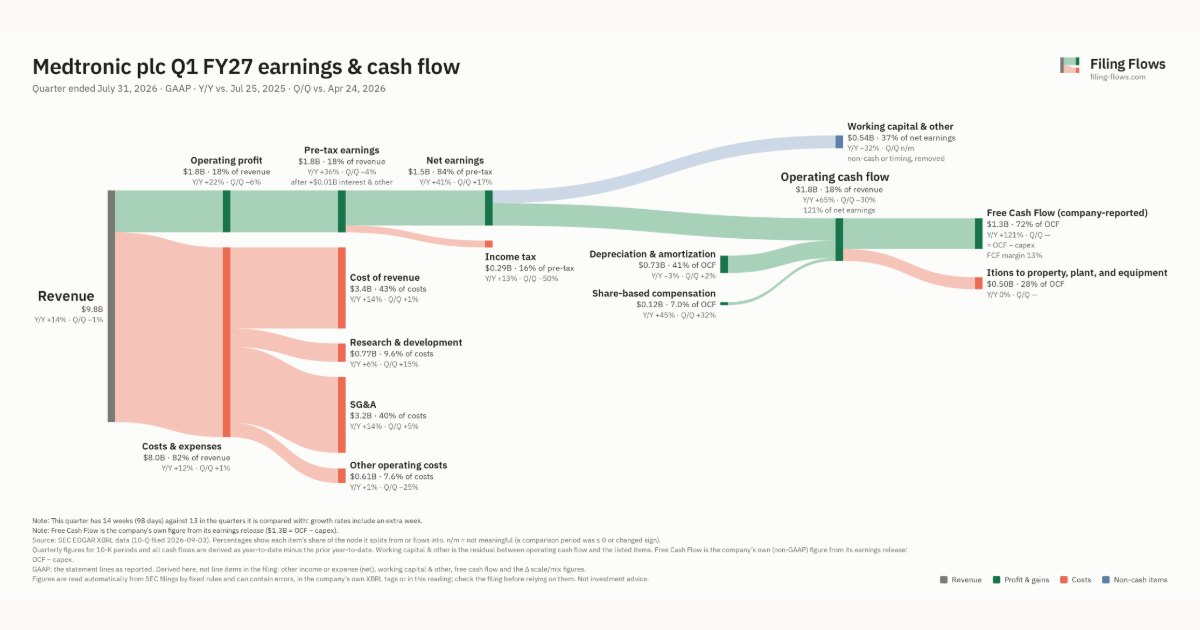
Q1 FY27 Revenue up 14% year over year to $9.8B · 15¢ of every $1 of revenue kept as net profit · operating margin 18.1%
Medtronic made $9.8B in Q1 FY27 (+14% Y/Y). Operating margin 18.1%, net earnings $1.5B. See where every dollar goes — costs, profit and cash — as a Sankey from the 10-Q filed Sep 3, 2026.
Drawing the Sankey…
Open the interactive Sankey → click any line for what the company wrote about it, compare Y/Y and Q/Q, export as PNG or PDF
What changed this quarter
Revenue was $9.8B in Q1 FY27, up 14% year over year and down 1% from the previous quarter.
Operating profit was $1.8B, a 18.1% margin (up 1.2 points year over year). Of the extra revenue versus Q1 FY26, 27% reached operating profit, above the 17% margin then. Total costs grew 12% against revenue growth of 14%. The fastest-growing cost line was SG&A (+14%). Net earnings were $1.5B, up 41% year over year. The effective tax rate was 16.3%.
Operating cash flow was $1.8B (up 65% year over year), 121% of net earnings. Non-cash charges added back $0.73B of depreciation and amortization and $0.12B of share-based compensation. Working capital and other items used $0.54B. After itions to property, plant, and equipment ($0.50B), free cash flow as the company reports it was $1.3B.
Quarterly history
| Quarter | Form | Filed | Revenue | Y/Y | Op. margin | Net earnings | Op. cash flow |
|---|---|---|---|---|---|---|---|
| Q1 FY27 | 10-Q | Sep 3, 2026 | $9.8B | +14% | 18.1% | $1.5B | $1.8B |
| Q4 FY26 | 10-K | Jun 18, 2026 | $9.8B | +10% | 19.1% | $1.2B | $2.6B |
| Q3 FY26 | 10-Q | Feb 24, 2026 | $9.0B | +9% | 16.2% | $1.1B | $2.7B |
| Q2 FY26 | 10-Q | Nov 25, 2025 | $9.0B | +7% | 18.8% | $1.4B | $925M |
| Q1 FY26 | 10-Q | Aug 26, 2025 | $8.6B | +8% | 16.8% | $1.0B | $1.1B |
| Q4 FY25 | 10-K | Jun 20, 2025 | $8.9B | +4% | 16.1% | $1.1B | $2.5B |
| Q3 FY25 | 10-Q | Feb 25, 2025 | $8.3B | +2% | 19.9% | $1.3B | $2.6B |
Charts
Interactive views
The same charts as the app — open one to draw it.
💵Where each $1 goesinteractive
Loading the interactive chart…
🌏Named in Asian annual reportsinteractive
Loading the interactive chart…
🔄Rotation against the market and its industry (RRG)interactive
Loading the interactive chart…
🔍Earnings qualityinteractive
Loading the interactive chart…
⚖️Fair value by methodinteractive
Loading the interactive chart…
🔭Outlook & guidanceinteractive
Loading the interactive chart…
📈Investments: gains and what it boughtinteractive
Loading the interactive chart…
🏭Its industry’s money flow (input-output)interactive
Loading the interactive chart…
About Medtronic
Medtronic plc, headquartered in Galway, Ireland, is the leading global healthcare technology company. Medtronic was founded in 1949 and today serves healthcare systems, physicians, clinicians, and patients in more than 150 countries worldwide. We remain committed to a mission written by our founder in 1960 that directs us “to contribute to human welfare by the application of biomedical engineering in the research, design, manufacture, and sale of products to alleviate pain, restore health, and extend life.” Our Mission — to alleviate pain, restore health, and extend life — empowers us to engineer the extraordinary and deliver better outcomes for our world. We are a company of dedication, honesty, integrity, and service. Building on this strong foundation, we are embracing our role as a healthcare technology leader and evolving our business strategy in three key areas:
In its own words, from its 10-K, filed Jun 18, 2026.
Medtronic against its Electromedical & Electrotherapeutic Apparatus peers
The largest companies of the same SEC industry, each at its latest quarter. Revenue growth: +14% against the peers' median +14%. Operating margin: 18.1% against the peers' median 6.3%.
| Company | Quarter | Revenue | Y/Y | Op. margin |
|---|---|---|---|---|
| MDT Medtronic | Q1 FY27 | $9.8B | +14% | 18.1% |
| ITGR Integer Holdings | Q3 2026 | $450M | -4% | 6.3% |
| LIVN LivaNova | Q3 2026 | $393M | +10% | 7.2% |
| CNMD Conmed | Q3 2026 | $336M | -0.7% | 11.1% |
| TMDX TransMedics Group | Q3 2026 | $203M | +41% | 13.9% |
| AXGN Axogen | Q3 2026 | $75.8M | +26% | 1.3% |
| OM Outset Medical | Q3 2026 | $33.6M | +14% | -36.5% |
| CBLL Ceribell | Q3 2026 | $29.3M | +30% | -70.0% |
| BLFS Biolife Solutions | Q2 2026 | $28.5M | +22% | 6.0% |
Source: Medtronic 10-Q on SEC EDGAR · CIK 1613103 · Electromedical & Electrotherapeutic Apparatus
Guidance and outlook
More on MDT
- How Medtronic makes money: revenue by segment
- Medtronic next earnings date and what analysts expect
- Medtronic stock forecast, price target and fair value
- Who owns Medtronic stock: holders, funds and Congress trades
- Medtronic guidance and outlook
- Is Medtronic a takeover target? LBO and rumors
- Medtronic recalls, complaints and regulation
History
Every quarter: Q1 FY27 results · Q4 FY26 results · Q3 FY26 results · Q2 FY26 results · Q1 FY26 results · Q4 FY25 results · Q3 FY25 results