Filing Flows › Consumer Staples › McCormick (MKC)
McCormick (MKC) earnings and revenue breakdown
Latest: Q3 FY26 · 10-Q filed Oct 1, 2026 · McCormick (MKC) Q3 FY26 earnings results →
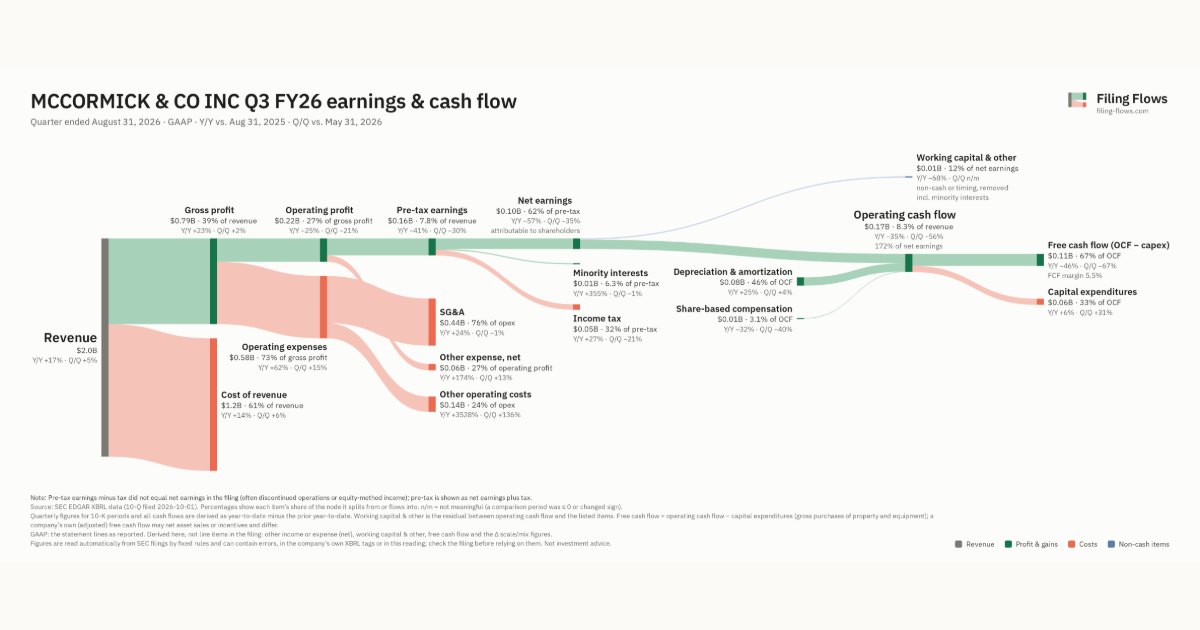
Q3 FY26 Revenue up 17% year over year to $2.0B · 5¢ of every $1 of revenue kept as net profit · operating margin 10.7%
McCormick made $2.0B in Q3 FY26 (+17% Y/Y). Operating margin 10.7%, net earnings $97.6M. See where every dollar goes — costs, profit and cash — as a Sankey from the 10-Q filed Oct 1, 2026.
Drawing the Sankey…
Open the interactive Sankey → click any line for what the company wrote about it, compare Y/Y and Q/Q, export as PNG or PDF
What changed this quarter
Revenue was $2.0B in Q3 FY26, up 17% year over year and up 5% from the previous quarter.
Gross margin was 39.3%, up 1.9 points from Q3 FY25. Operating profit was $0.22B, a 10.7% margin (down 6.0 points year over year). Operating profit fell $0.07B even though revenue rose $0.30B versus Q3 FY25, so costs grew faster than sales. Operating expenses grew 62% against revenue growth of 17%. The fastest-growing cost line was Other operating costs (+3528%). Net earnings were $0.10B, down 57% year over year. The effective tax rate was 31.7%.
Operating cash flow was $0.17B (down 35% year over year), 156% of net income including minority interests. Non-cash charges added back $0.08B of depreciation and amortization and $0.01B of share-based compensation. Working capital and other items used $0.02B. Capital expenditures of $0.06B left free cash flow of $0.11B.
Quarterly history
| Quarter | Form | Filed | Revenue | Y/Y | Op. margin | Net earnings | Op. cash flow |
|---|---|---|---|---|---|---|---|
| Q3 FY26 | 10-Q | Oct 1, 2026 | $2.0B | +17% | 10.7% | $97.6M | $168M |
| Q2 FY26 | 10-Q | Jun 25, 2026 | $1.9B | +17% | 14.3% | $150M | $380M |
| Q1 FY26 | 10-Q | Mar 31, 2026 | $1.9B | +17% | 12.1% | $1.0B | $50.9M |
| Q4 FY25 | 10-K | Jan 22, 2026 | $1.9B | +3% | 16.8% | $227M | $542M |
| Q3 FY25 | 10-Q | Oct 7, 2025 | $1.7B | +3% | 16.7% | $226M | $259M |
| Q2 FY25 | 10-Q | Jun 26, 2025 | $1.7B | +1% | 14.8% | $175M | $45.9M |
| Q4 FY24 | 10-K | Jan 23, 2025 | $1.8B | +3% | 17.0% | $215M | $459M |
Charts
Interactive views
The same charts as the app — open one to draw it.
💵Where each $1 goesinteractive
Loading the interactive chart…
🌏Named in Asian annual reportsinteractive
Loading the interactive chart…
🔄Rotation against the market and its industry (RRG)interactive
Loading the interactive chart…
🔍Earnings qualityinteractive
Loading the interactive chart…
⚖️Fair value by methodinteractive
Loading the interactive chart…
🔭Outlook & guidanceinteractive
Loading the interactive chart…
📈Investments: gains and what it boughtinteractive
Loading the interactive chart…
🏭Its industry’s money flow (input-output)interactive
Loading the interactive chart…
Customers and suppliers named in filings
Sells to
- WMT — 12% of its revenue · Stated in 10-K (sentence) · source
- PEP — 12% of its revenue · Stated in 10-K (sentence) · source
About McCormick
McCormick is a global leader in flavor. We manufacture, market, and distribute spices, seasoning mixes, condiments, and other flavorful products to the entire food industry: retailers, food manufacturers, and foodservice businesses. We also are partners in a number of joint ventures that are involved in the manufacture and sale of flavorful products, the most significant of which is McCormick de Mexico. Our major sales, distribution, and production facilities are located in North America, Europe, and China. Additional facilities are based in Australia, Central America, Thailand, and South Africa.
In its own words, from its annual report, filed Jan 23, 2025.
McCormick against its Miscellaneous Food Preparations & Kindred Products peers
The largest companies of the same SEC industry, each at its latest quarter. Revenue growth: +17% against the peers' median -2%. Operating margin: 10.7% against the peers' median 10.7%.
| Company | Quarter | Revenue | Y/Y | Op. margin |
|---|---|---|---|---|
| MKC McCormick | Q3 FY26 | $2.0B | +17% | 10.7% |
| UTZ Utz Brands | Q3 2026 | $369M | -2% | -5.9% |
| MED Medifast | Q3 2026 | $72.0M | -19% | -26.9% |
| JVA Coffee Holding | Q3 FY26 | $21.7M | -9% | 10.7% |
Source: McCormick 10-Q on SEC EDGAR · CIK 63754 · Miscellaneous Food Preparations & Kindred Products
13F: who owns MKC and who is buying
More on MKC
History
Every quarter: Q3 FY26 results · Q2 FY26 results · Q1 FY26 results · Q4 FY25 results · Q3 FY25 results · Q2 FY25 results · Q4 FY24 results