Filing Flows › Consumer Staples › PepsiCo (PEP)
PepsiCo (PEP) earnings and revenue breakdown
Latest: Q3 2026 · 10-Q filed Oct 8, 2026 · PepsiCo (PEP) Q3 2026 earnings results →
Q3 2026 Revenue up 6% year over year to $25.3B · 12¢ of every $1 of revenue kept as net profit · operating margin 16.9%
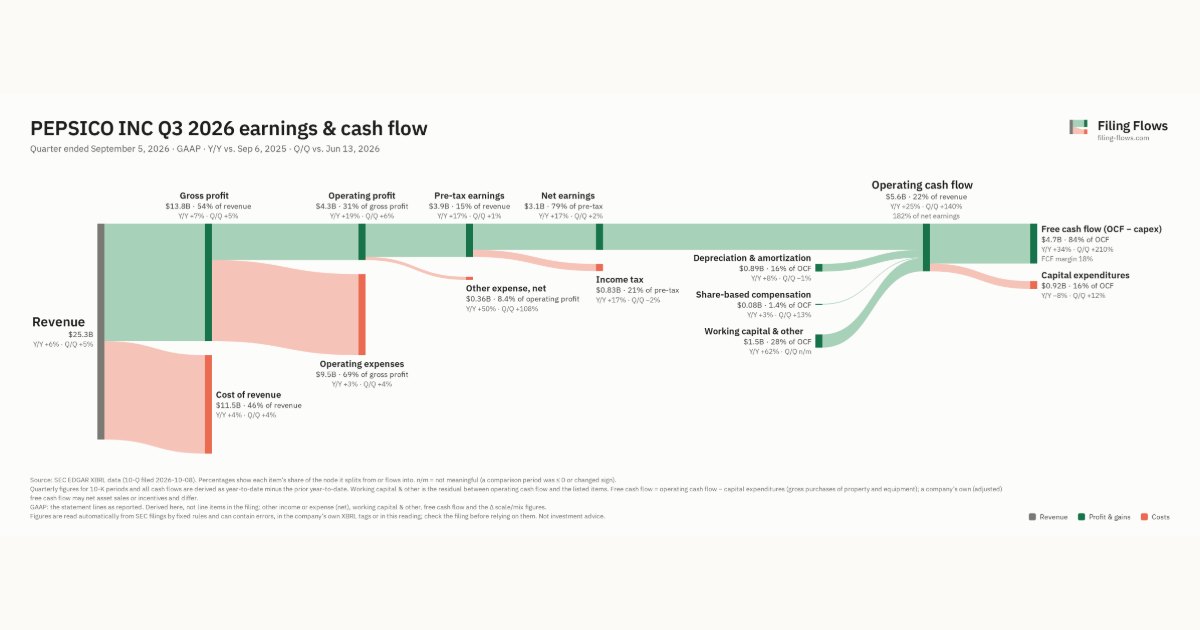
PepsiCo made $25.3B in Q3 2026 (+6% Y/Y). Operating margin 16.9%, net earnings $3.1B. See where every dollar goes — costs, profit and cash — as a Sankey from the 10-Q filed Oct 8, 2026.
Drawing the Sankey…
Open the interactive Sankey → click any line for what the company wrote about it, compare Y/Y and Q/Q, export as PNG or PDF
What changed this quarter
Revenue was $25.3B in Q3 2026, up 6% year over year and up 5% from the previous quarter.
Gross margin was 54.4%, up 0.8 points from Q3 2025. Operating profit was $4.3B, a 16.9% margin (up 1.9 points year over year). Of the extra revenue versus Q3 2025, 52% reached operating profit, above the 15% margin then. Operating expenses grew 3% against revenue growth of 6%. Net earnings were $3.0B, up 17% year over year. The effective tax rate was 21.4%.
Operating cash flow was $5.6B (up 25% year over year), 182% of net earnings. Non-cash charges added back $0.89B of depreciation and amortization and $0.08B of share-based compensation. Working capital and other items added $1.5B. Capital expenditures of $0.92B left free cash flow of $4.7B.
Quarterly history
| Quarter | Form | Filed | Revenue | Y/Y | Op. margin | Net earnings | Op. cash flow |
|---|---|---|---|---|---|---|---|
| Q3 2026 | 10-Q | Oct 8, 2026 | $25.3B | +6% | 16.9% | $3.1B | $5.6B |
| Q2 2026 | 10-Q | Jul 9, 2026 | $24.2B | +6% | 16.6% | $3.0B | — |
| Q1 2026 | 10-Q | Apr 16, 2026 | $19.4B | +8% | 16.5% | $2.3B | $41.0M |
| Q4 2025 | 10-K | Feb 3, 2026 | $29.3B | +6% | 12.1% | $2.6B | — |
| Q3 2025 | 10-Q | Oct 9, 2025 | $23.9B | +3% | 14.9% | $2.6B | $4.5B |
| Q2 2025 | 10-Q | Jul 17, 2025 | $22.7B | +1% | 7.9% | $1.3B | — |
| Q4 2024 | 10-K | Feb 4, 2025 | $27.8B | -0.2% | 8.1% | $1.5B | — |
Charts
Interactive views
The same charts as the app — open one to draw it.
💵Where each $1 goesinteractive
Loading the interactive chart…
🌏Named in Asian annual reportsinteractive
Loading the interactive chart…
🔄Rotation against the market and its industry (RRG)interactive
Loading the interactive chart…
🔍Earnings qualityinteractive
Loading the interactive chart…
⚖️Fair value by methodinteractive
Loading the interactive chart…
🔭Outlook & guidanceinteractive
Loading the interactive chart…
📈Investments: gains and what it boughtinteractive
Loading the interactive chart…
🏭Its industry’s money flow (input-output)interactive
Loading the interactive chart…
Customers and suppliers named in filings
Sells to
Buys from
About PepsiCo
When used in this report, the terms “we,” “us,” “our,” “PepsiCo” and the “Company” mean PepsiCo, Inc. and its consolidated subsidiaries, collectively. Certain terms used in this Annual Report on Form 10-K are defined in the Glossary included in Item 7. of this report. We were incorporated in Delaware in 1919 and reincorporated in North Carolina in 1986. We are a leading global beverage and convenient food company with a complementary portfolio of brands, including Lay’s, Doritos, Cheetos, Gatorade, Pepsi-Cola, Mountain Dew, Quaker and SodaStream. Through our operations, authorized bottlers, contract manufacturers and other third parties, we make, market, distribute and sell a wide variety of beverages and convenient foods, serving customers and consumers in more than 200 countries and territories.
In its own words, from its 10-K, filed Feb 3, 2026.
PepsiCo against its Beverages peers
The largest companies of the same SEC industry, each at its latest quarter. Revenue growth: +6% against the peers' median +6%. Operating margin: 16.9% against the peers' median 18.2%.
| Company | Quarter | Revenue | Y/Y | Op. margin |
|---|---|---|---|---|
| PEP PepsiCo | Q3 2026 | $25.3B | +6% | 16.9% |
| KO Coca Cola | Q3 2026 | $13.4B | +7% | 33.4% |
| KDP Keurig Dr Pepper | Q3 2026 | $7.3B | +71% | 18.2% |
| STZ Constellation Brands | Q2 FY27 | $2.8B | +6% | 28.6% |
| PRMB Primo Brands | Q3 2026 | $1.8B | +3% | 13.7% |
| BF-B Brown Forman | Q1 FY27 | $1.2B | -0.8% | 21.3% |
| WEST Westrock Coffee | Q3 2026 | $300M | -15% | 1.1% |
| COCO Vita Coco Company | Q3 2026 | $244M | +34% | 18.6% |
| BRCC BRC | Q3 2026 | $108M | +7% | -6.9% |
Source: PepsiCo 10-Q on SEC EDGAR · CIK 77476 · Beverages
Guidance and outlook
13F: who owns PEP and who is buying
More on PEP
History
Every quarter: Q3 2026 results · Q2 2026 results · Q1 2026 results · Q4 2025 results · Q3 2025 results · Q2 2025 results · Q4 2024 results