Filing Flows › Consumer Staples › Brown Forman (BF-B)
Brown Forman (BF-B) earnings and revenue breakdown
Latest: Q1 FY27 · 10-Q filed Sep 2, 2026 · Brown Forman (BF-B) Q1 FY27 earnings results →
Q1 FY27 Revenue down 1% year over year to $1.2B · 15¢ of every $1 of revenue kept as net profit · operating margin 21.3%
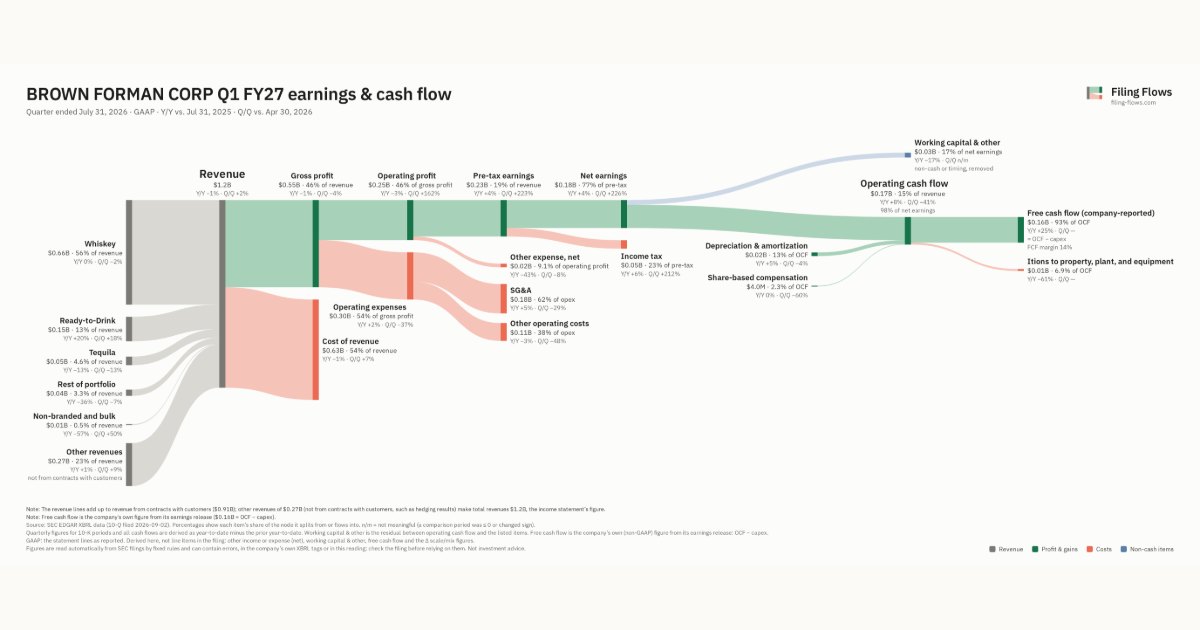
Brown Forman made $1.2B in Q1 FY27 (-0.8% Y/Y): Whiskey $658M, Other revenues $270M, Ready-to-Drink $154M. Operating margin 21.3%, net earnings $176M. See where every dollar goes — costs, profit and cash — as a Sankey from the 10-Q filed Sep 2, 2026.
Drawing the Sankey…
Open the interactive Sankey → click any line for what the company wrote about it, compare Y/Y and Q/Q, export as PNG or PDF
What changed this quarter
Revenue was $1.2B in Q1 FY27, down 1% year over year and up 2% from the previous quarter. Whiskey was the largest line at 56% of revenue. Rest of portfolio lost $0.02B year over year (down 36%), 220% of the total change.
Gross margin was 46.5%, up 0.1 points from Q1 FY26. Operating profit was $0.25B, a 21.3% margin (down 0.5 points year over year). Operating expenses grew 2% against a revenue fall of 1%. Net earnings were $0.18B, up 4% year over year. The effective tax rate was 23.1%.
Operating cash flow was $0.17B (up 8% year over year), 98% of net earnings. Non-cash charges added back $0.02B of depreciation and amortization and $4.0M of share-based compensation. Working capital and other items used $0.03B. After itions to property, plant, and equipment ($0.01B), free cash flow as the company reports it was $0.16B.
Quarterly history
| Quarter | Form | Filed | Revenue | Y/Y | Op. margin | Net earnings | Op. cash flow |
|---|---|---|---|---|---|---|---|
| Q1 FY27 | 10-Q | Sep 2, 2026 | $1.2B | -0.8% | 21.3% | $176M | $173M |
| Q4 FY26 | 10-K | Jun 12, 2026 | $1.2B | +3% | 8.3% | $54.0M | $291M |
| Q3 FY26 | 10-Q | Mar 4, 2026 | $1.4B | +4% | 24.4% | $267M | $417M |
| Q2 FY26 | 10-Q | Dec 4, 2025 | $1.3B | -3% | 22.8% | $224M | $132M |
| Q1 FY26 | 10-Q | Aug 28, 2025 | $1.2B | -2% | 21.8% | $170M | $160M |
| Q4 FY25 | 10-K | Jun 13, 2025 | $1.1B | -6% | 18.3% | $146M | $152M |
| Q3 FY25 | 10-Q | Mar 5, 2025 | $1.3B | -4% | 20.8% | $270M | $317M |
Charts
Interactive views
The same charts as the app — open one to draw it.
💵Where each $1 goesinteractive
Loading the interactive chart…
🌏Named in Asian annual reportsinteractive
Loading the interactive chart…
🔄Rotation against the market and its industry (RRG)interactive
Loading the interactive chart…
🔍Earnings qualityinteractive
Loading the interactive chart…
⚖️Fair value by methodinteractive
Loading the interactive chart…
🔭Outlook & guidanceinteractive
Loading the interactive chart…
📈Investments: gains and what it boughtinteractive
Loading the interactive chart…
🏭Its industry’s money flow (input-output)interactive
Loading the interactive chart…
About Brown Forman
Brown-Forman Corporation (the “Company,” “Brown-Forman,” “we,” “us,” or “our” below) was incorporated under the laws of the State of Delaware in 1933, successor to a business founded in 1870 as a partnership and later incorporated under the laws of the Commonwealth of Kentucky in 1901. We primarily manufacture, distill, bottle, import, export, market, and sell a wide variety of beverage alcohol products under recognized brands. We employ approximately 4,900 people (excluding individuals who work on a part-time or temporary basis) on six continents, including approximately 1,900 people in the United States (approximately 7% of whom are represented by a union) and 700 people in Louisville, Kentucky, USA, home of our world headquarters. According to International Wine & Spirit Research (IWSR), we are the largest American-owned premium-plus spirits company.
In its own words, from its 10-K, filed Jun 12, 2026.
Brown Forman against its Beverages peers
The largest companies of the same SEC industry, each at its latest quarter. Revenue growth: -0.8% against the peers' median +6%. Operating margin: 21.3% against the peers' median 18.2%.
| Company | Quarter | Revenue | Y/Y | Op. margin |
|---|---|---|---|---|
| BF-B Brown Forman | Q1 FY27 | $1.2B | -0.8% | 21.3% |
| PEP PepsiCo | Q3 2026 | $25.3B | +6% | 16.9% |
| KO Coca Cola | Q3 2026 | $13.4B | +7% | 33.4% |
| KDP Keurig Dr Pepper | Q3 2026 | $7.3B | +71% | 18.2% |
| STZ Constellation Brands | Q2 FY27 | $2.8B | +6% | 28.6% |
| PRMB Primo Brands | Q3 2026 | $1.8B | +3% | 13.7% |
| WEST Westrock Coffee | Q3 2026 | $300M | -15% | 1.1% |
| COCO Vita Coco Company | Q3 2026 | $244M | +34% | 18.6% |
| BRCC BRC | Q3 2026 | $108M | +7% | -6.9% |
Source: Brown Forman 10-Q on SEC EDGAR · CIK 14693 · Beverages
13F: who owns BF-B and who is buying
More on BF-B
History
Every quarter: Q1 FY27 results · Q4 FY26 results · Q3 FY26 results · Q2 FY26 results · Q1 FY26 results · Q4 FY25 results · Q3 FY25 results
- Brown Forman gross margin by quarter
- Brown Forman operating margin by quarter
- Brown Forman net income by quarter
- Brown Forman free cash flow by quarter
- Brown Forman capital expenditures by quarter
- Brown Forman Whiskey revenue by quarter
- Brown Forman Ready-to-Drink revenue by quarter
- Brown Forman Tequila revenue by quarter