Filing Flows › Consumer Staples › Coca Cola (KO)
Coca Cola (KO) earnings and revenue breakdown
Latest: Q3 2026 · 10-Q filed Oct 28, 2026 · Coca Cola (KO) Q3 2026 earnings results →
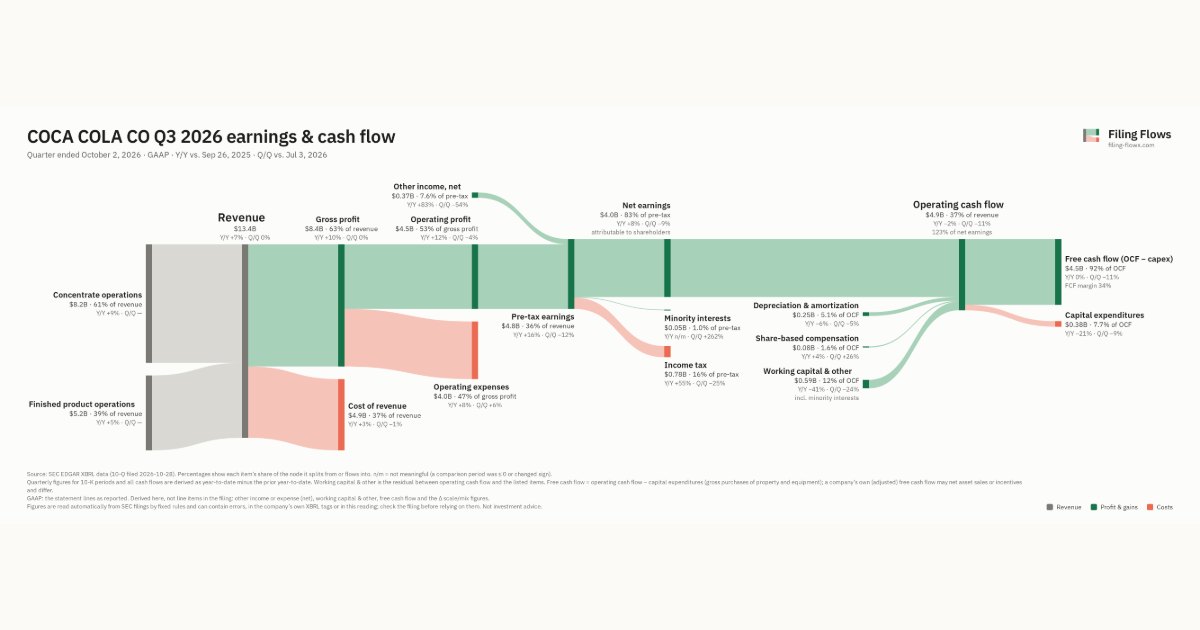
Q3 2026 Revenue up 7% year over year to $13.4B · 30¢ of every $1 of revenue kept as net profit · operating margin 33.4%
Coca Cola made $13.4B in Q3 2026 (+7% Y/Y): Concentrate operations $8.2B, Finished product operations $5.2B. Operating margin 33.4%, net earnings $4.0B. See where every dollar goes — costs, profit and cash — as a Sankey from the 10-Q filed Oct 28, 2026.
Drawing the Sankey…
Open the interactive Sankey → click any line for what the company wrote about it, compare Y/Y and Q/Q, export as PNG or PDF
What changed this quarter
Revenue was $13.4B in Q3 2026, up 7% year over year and roughly flat from the previous quarter. Concentrate operations was the largest line at 61% of revenue. Concentrate operations added $0.70B year over year (up 9%), 76% of the total change.
Gross margin was 63.2%, up 1.7 points from Q3 2025. Operating profit was $4.5B, a 33.4% margin (up 1.4 points year over year). Of the extra revenue versus Q3 2025, 52% reached operating profit, above the 32% margin then. Operating expenses grew 8% against revenue growth of 7%. Net earnings were $4.0B, up 8% year over year. The effective tax rate was 16.1%.
Operating cash flow was $4.9B (down 2% year over year), 121% of net earnings. Non-cash charges added back $0.25B of depreciation and amortization and $0.08B of share-based compensation. Working capital and other items added $0.54B. Capital expenditures of $0.38B left free cash flow of $4.5B.
Quarterly history
| Quarter | Form | Filed | Revenue | Y/Y | Op. margin | Net earnings | Op. cash flow |
|---|---|---|---|---|---|---|---|
| Q3 2026 | 10-Q | Oct 28, 2026 | $13.4B | +7% | 33.4% | $4.0B | $4.9B |
| Q2 2026 | 10-Q | Jul 29, 2026 | $13.4B | +7% | 34.9% | $4.4B | $5.5B |
| Q1 2026 | 10-Q | Apr 30, 2026 | $12.5B | +12% | 35.0% | $3.9B | $2.0B |
| Q4 2025 | 10-K | Feb 20, 2026 | $11.8B | +2% | 15.6% | $2.3B | $3.8B |
| Q3 2025 | 10-Q | Oct 23, 2025 | $12.5B | +5% | 32.0% | $3.7B | $5.0B |
| Q2 2025 | 10-Q | Jul 24, 2025 | $12.5B | +1% | 34.1% | $3.8B | $3.8B |
| Q1 2025 | 10-Q | May 1, 2025 | $11.1B | -2% | 32.9% | $3.3B | −$5.2B |
Charts
Interactive views
The same charts as the app — open one to draw it.
💵Where each $1 goesinteractive
Loading the interactive chart…
🌏Named in Asian annual reportsinteractive
Loading the interactive chart…
🔄Rotation against the market and its industry (RRG)interactive
Loading the interactive chart…
🔍Earnings qualityinteractive
Loading the interactive chart…
⚖️Fair value by methodinteractive
Loading the interactive chart…
🔭Outlook & guidanceinteractive
Loading the interactive chart…
📈Investments: gains and what it boughtinteractive
Loading the interactive chart…
🏭Its industry’s money flow (input-output)interactive
Loading the interactive chart…
Customers and suppliers named in filings
Sells to
- BABB · Stated in 10-K (named, share not stated) · source
- COKE · Stated in 10-K (share of revenue from its products) · source
Buys from
About Coca Cola
In this report, the terms “The Coca-Cola Company,” “Company,” “we,” “us” and “our” mean The Coca-Cola Company and all entities included in our consolidated financial statements. The Coca-Cola Company is a total beverage company, and beverage products bearing our trademarks, sold in the United States since 1886, are now sold in more than 200 countries and territories. We own or license and market numerous beverage brands, which we group into the following categories: Trademark Coca-Cola; sparkling flavors; water, sports, coffee and tea; juice, value-added dairy and plant-based beverages; and emerging beverages. We own and market several of the world’s largest nonalcoholic sparkling soft drink brands, including Coca-Cola, Sprite, Coca-Cola Zero Sugar, Fanta and Diet Coke/Coca-Cola Light.
In its own words, from its 10-K, filed Feb 20, 2026.
Coca Cola against its Beverages peers
The largest companies of the same SEC industry, each at its latest quarter. Revenue growth: +7% against the peers' median +6%. Operating margin: 33.4% against the peers' median 18.2%.
| Company | Quarter | Revenue | Y/Y | Op. margin |
|---|---|---|---|---|
| KO Coca Cola | Q3 2026 | $13.4B | +7% | 33.4% |
| PEP PepsiCo | Q3 2026 | $25.3B | +6% | 16.9% |
| KDP Keurig Dr Pepper | Q3 2026 | $7.3B | +71% | 18.2% |
| STZ Constellation Brands | Q2 FY27 | $2.8B | +6% | 28.6% |
| PRMB Primo Brands | Q3 2026 | $1.8B | +3% | 13.7% |
| BF-B Brown Forman | Q1 FY27 | $1.2B | -0.8% | 21.3% |
| WEST Westrock Coffee | Q3 2026 | $300M | -15% | 1.1% |
| COCO Vita Coco Company | Q3 2026 | $244M | +34% | 18.6% |
| BRCC BRC | Q3 2026 | $108M | +7% | -6.9% |
Source: Coca Cola 10-Q on SEC EDGAR · CIK 21344 · Beverages
Guidance and outlook
13F: who owns KO and who is buying
More on KO
History
Every quarter: Q3 2026 results · Q2 2026 results · Q1 2026 results · Q4 2025 results · Q3 2025 results · Q2 2025 results · Q1 2025 results
- Coca Cola guidance history: guided vs reported
- Coca Cola gross margin by quarter
- Coca Cola operating margin by quarter
- Coca Cola net income by quarter
- Coca Cola free cash flow by quarter
- Coca Cola capital expenditures by quarter
- Coca Cola Concentrate operations revenue by quarter
- Coca Cola Finished product operations revenue by quarter