Filing Flows › Materials › Newmont (NEM)
Newmont (NEM) earnings and revenue breakdown
Latest: Q3 2026 · 10-Q filed Oct 22, 2026 · Newmont (NEM) Q3 2026 earnings results →
Q3 2026 Revenue up 15% year over year to $6.4B · 39¢ of every $1 of revenue kept as net profit · operating margin 49.7%
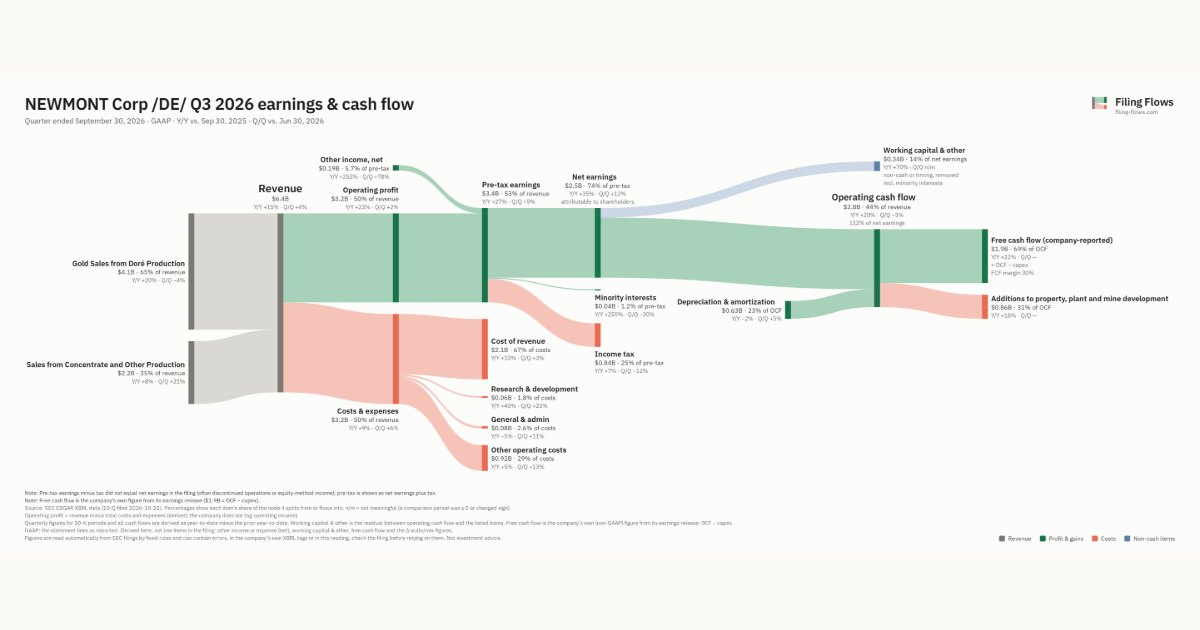
Newmont made $6.4B in Q3 2026 (+15% Y/Y): Gold Sales from Doré Production $4.1B, Sales from Concentrate and Other Production $2.2B. Operating margin 49.7%, net earnings $2.5B. See where every dollar goes — costs, profit and cash — as a Sankey from the 10-Q filed Oct 22, 2026.
Drawing the Sankey…
Open the interactive Sankey → click any line for what the company wrote about it, compare Y/Y and Q/Q, export as PNG or PDF
What changed this quarter
Revenue was $6.4B in Q3 2026, up 15% year over year and up 4% from the previous quarter. Gold Sales from Doré Production was the largest line at 65% of revenue. Gold Sales from Doré Production added $0.68B year over year (up 20%), 81% of the total change.
Operating profit was $3.2B, a 49.7% margin (up 3.1 points year over year). Of the extra revenue versus Q3 2025, 70% reached operating profit, above the 47% margin then. Total costs grew 9% against revenue growth of 15%. The fastest-growing cost line was Research & development (+45%). Net earnings were $2.5B, up 35% year over year. The effective tax rate was 25.0%.
Operating cash flow was $2.8B (up 20% year over year), 110% of net earnings. Non-cash charges added back $0.63B of depreciation and amortization. Working capital and other items used $0.38B. After additions to property, plant and mine development ($0.86B), free cash flow as the company reports it was $1.9B.
Quarterly history
| Quarter | Form | Filed | Revenue | Y/Y | Op. margin | Net earnings | Op. cash flow |
|---|---|---|---|---|---|---|---|
| Q3 2026 | 10-Q | Oct 22, 2026 | $6.4B | +15% | 49.7% | $2.5B | $2.8B |
| Q2 2026 | 10-Q | Jul 23, 2026 | $6.1B | +15% | 50.6% | $2.2B | $2.9B |
| Q1 2026 | 10-Q | Apr 23, 2026 | $7.3B | +46% | 61.1% | $3.3B | $3.8B |
| Q4 2025 | 10-K | Feb 19, 2026 | $6.8B | +21% | 45.0% | $1.3B | $3.6B |
| Q3 2025 | 10-Q | Oct 23, 2025 | $5.5B | +20% | 46.6% | $1.8B | $2.3B |
| Q2 2025 | 10-Q | Jul 24, 2025 | $5.3B | +21% | 57.7% | $2.1B | $2.4B |
| Q1 2025 | 10-Q | Apr 24, 2025 | $5.0B | +24% | 44.9% | $1.9B | $2.0B |
Charts
In supply chains and themes
Interactive views
The same charts as the app — open one to draw it.
💵Where each $1 goesinteractive
Loading the interactive chart…
🌏Named in Asian annual reportsinteractive
Loading the interactive chart…
🔄Rotation against the market and its industry (RRG)interactive
Loading the interactive chart…
🔍Earnings qualityinteractive
Loading the interactive chart…
⚖️Fair value by methodinteractive
Loading the interactive chart…
🔭Outlook & guidanceinteractive
Loading the interactive chart…
📈Investments: gains and what it boughtinteractive
Loading the interactive chart…
🏭Its industry’s money flow (input-output)interactive
Loading the interactive chart…
About Newmont
Newmont Corporation was incorporated in 1921 and is primarily a gold producer with significant operations and/or assets in the United States, Papua New Guinea, Australia, Ghana, Suriname, Argentina, Dominican Republic, Chile, Peru, Ecuador, Mexico, and Canada. At December 31, 2025, Newmont had attributable proven and probable gold reserves of 118.2 million ounces, attributable measured and indicated gold resources of 88.1 million ounces, attributable inferred gold resources of 60.6 million ounces, and an aggregate land position of approximately 19,200 square miles (49,800 square kilometers). Newmont is also engaged in the production of copper, silver, lead, and zinc. As the world’s leading gold company, Newmont remains committed to creating value and improving lives through sustainable and responsible mining.
In its own words, from its 10-K, filed Feb 19, 2026.
Newmont against its Gold and Silver Ores peers
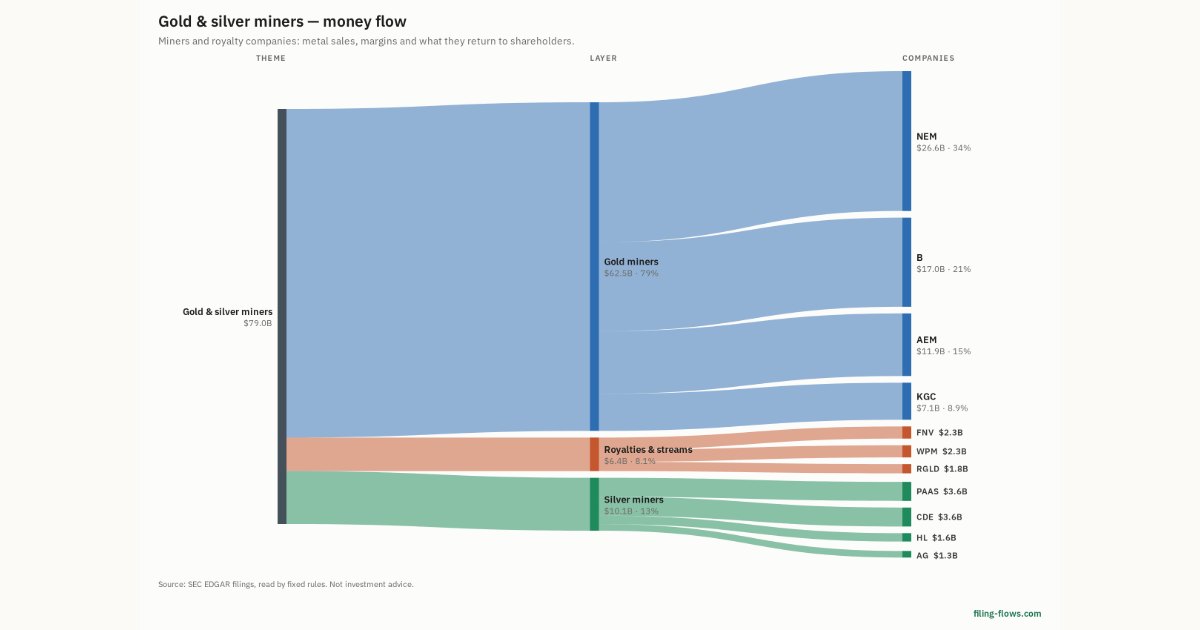
The largest companies of the same SEC industry, each at its latest quarter. Revenue growth: +15% against the peers' median +27%. Operating margin: 49.7% against the peers' median 38.5%.
| Company | Quarter | Revenue | Y/Y | Op. margin |
|---|---|---|---|---|
| NEM Newmont | Q3 2026 | $6.4B | +15% | 49.7% |
| B Barrick Mining | Q2 2025 | $3.7B | +16% | 38.5% |
| CDE Coeur Mining | Q3 2026 | $984M | +77% | 17.7% |
| WPM Wheaton Precious Metals | Q3 2026 | $772M | — | 66.2% |
| AG First Majestic Silver | Q3 2026 | $394M | — | 38.6% |
| FNV Franco Nevada | Q2 2025 | $369M | +42% | 82.8% |
| MUX McEwen | Q2 2026 | $59.2M | +27% | 13.0% |
| IAUX i-80 Gold | Q3 2026 | $32.7M | +2% | -132.4% |
| URG Ur-Energy | Q2 2026 | $14.4M | +38% | -128.3% |
Source: Newmont 10-Q on SEC EDGAR · CIK 1164727 · Gold and Silver Ores
Guidance and outlook
13F: who owns NEM and who is buying
More on NEM
History
Every quarter: Q3 2026 results · Q2 2026 results · Q1 2026 results · Q4 2025 results · Q3 2025 results · Q2 2025 results · Q1 2025 results
- Newmont guidance history: guided vs reported
- Newmont operating margin by quarter
- Newmont net income by quarter
- Newmont free cash flow by quarter
- Newmont R&D spending by quarter
- Newmont capital expenditures by quarter
- Newmont Gold Sales from Doré Production revenue by quarter
- Newmont Sales from Concentrate and Other Production revenue by quarter