Filing Flows › Materials › Wheaton Precious Metals (WPM)
Wheaton Precious Metals (WPM) earnings and revenue breakdown
Latest: Q3 2026 · 6-K filed Nov 6, 2026 · Wheaton Precious Metals (WPM) Q3 2026 earnings results →
Q3 2026 53¢ of every $1 of revenue kept as net profit · operating margin 66.2%
Wheaton Precious Metals made $772M in Q3 2026. Operating margin 66.2%, net earnings $410M. See where every dollar goes — costs, profit and cash — as a Sankey from the 6-K filed Nov 6, 2026.
Drawing the Sankey…
Open the interactive Sankey → click any line for what the company wrote about it, compare Y/Y and Q/Q, export as PNG or PDF
What changed this quarter
Revenue was $771.7M in Q3 2026.
Gross margin was 69.8%. Operating profit was $511.0M, a 66.2% margin. Net earnings were $410.2M. The effective tax rate was 15.9%.
Quarterly history
| Quarter | Form | Filed | Revenue | Y/Y | Op. margin | Net earnings | Op. cash flow |
|---|---|---|---|---|---|---|---|
| Q3 2026 | 6-K | Nov 6, 2026 | $772M | — | 66.2% | $410M | — |
| Q2 2025 | 6-K | Aug 8, 2025 | $503M | +68% | 65.5% | $292M | $415M |
Charts
In supply chains and themes
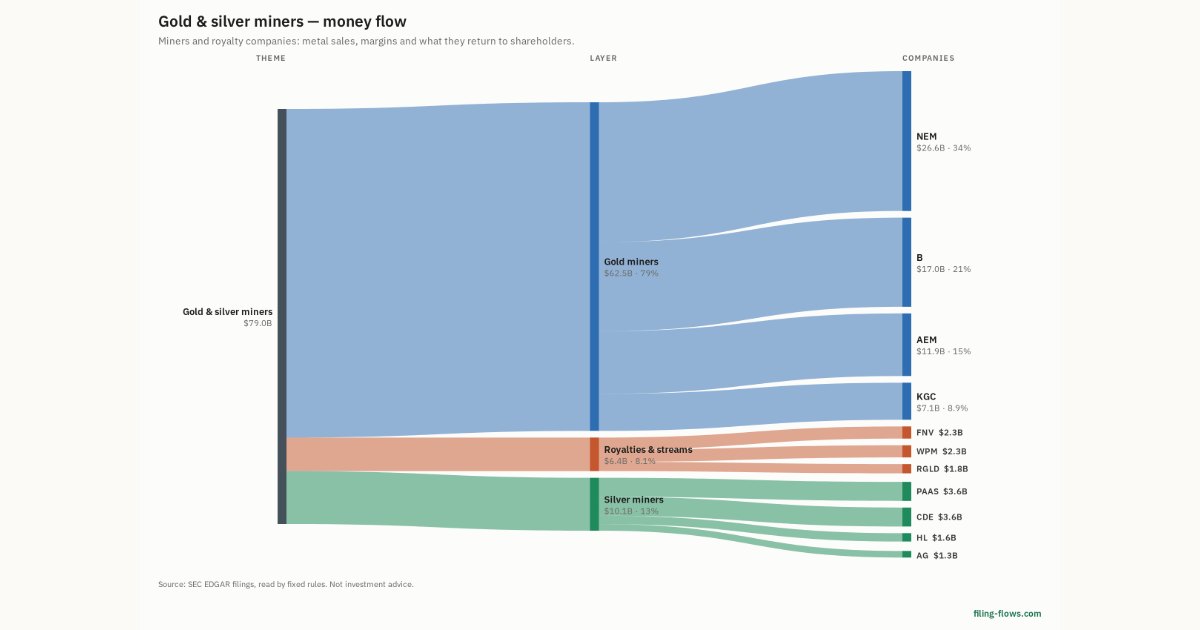
Interactive views
The same charts as the app — open one to draw it.
💵Where each $1 goesinteractive
Loading the interactive chart…
🌏Named in Asian annual reportsinteractive
Loading the interactive chart…
🔄Rotation against the market and its industry (RRG)interactive
Loading the interactive chart…
🔍Earnings qualityinteractive
Loading the interactive chart…
⚖️Fair value by methodinteractive
Loading the interactive chart…
🔭Outlook & guidanceinteractive
Loading the interactive chart…
📈Investments: gains and what it boughtinteractive
Loading the interactive chart…
🏭Its industry’s money flow (input-output)interactive
Loading the interactive chart…
About Wheaton Precious Metals
Wheaton is the world’s premier precious metals streaming company with the highest-quality portfolio of long-life, low-cost assets. Its business model offers investors commodity price leverage and exploration upside but with a much lower risk profile than a traditional mining company. Wheaton delivers amongst the highest cash operating margins in the mining industry, allowing it to pay a competitive dividend and continue to grow through accretive acquisitions. Wheaton is committed to strong ESG practices and giving back to the communities where Wheaton and its mining partners operate. Wheaton creates sustainable value through streaming for all of its stakeholders.
In its own words, from its 6-K, filed Aug 7, 2026.
Wheaton Precious Metals against its Gold and Silver Ores peers
The largest companies of the same SEC industry, each at its latest quarter. Operating margin: 66.2% against the peers' median 38.5%.
| Company | Quarter | Revenue | Y/Y | Op. margin |
|---|---|---|---|---|
| WPM Wheaton Precious Metals | Q3 2026 | $772M | — | 66.2% |
| NEM Newmont | Q3 2026 | $6.4B | +15% | 49.7% |
| B Barrick Mining | Q2 2025 | $3.7B | +16% | 38.5% |
| CDE Coeur Mining | Q3 2026 | $984M | +77% | 17.7% |
| AG First Majestic Silver | Q3 2026 | $394M | — | 38.6% |
| FNV Franco Nevada | Q2 2025 | $369M | +42% | 82.8% |
| MUX McEwen | Q2 2026 | $59.2M | +27% | 13.0% |
| IAUX i-80 Gold | Q3 2026 | $32.7M | +2% | -132.4% |
| URG Ur-Energy | Q2 2026 | $14.4M | +38% | -128.3% |
Source: Wheaton Precious Metals 6-K on SEC EDGAR · CIK 1323404 · Gold and Silver Ores
13F: who owns WPM and who is buying
More on WPM
History
Every quarter: Q3 2026 results · Q2 2025 results