Filing Flows › Communication Services › Netflix (NFLX)
Netflix (NFLX) earnings and revenue breakdown
Latest: Q3 2026 · 10-Q filed Oct 21, 2026 · Netflix (NFLX) Q3 2026 earnings results →
Q3 2026 Revenue up 12% year over year to $12.9B · 28¢ of every $1 of revenue kept as net profit · operating margin 34.6%
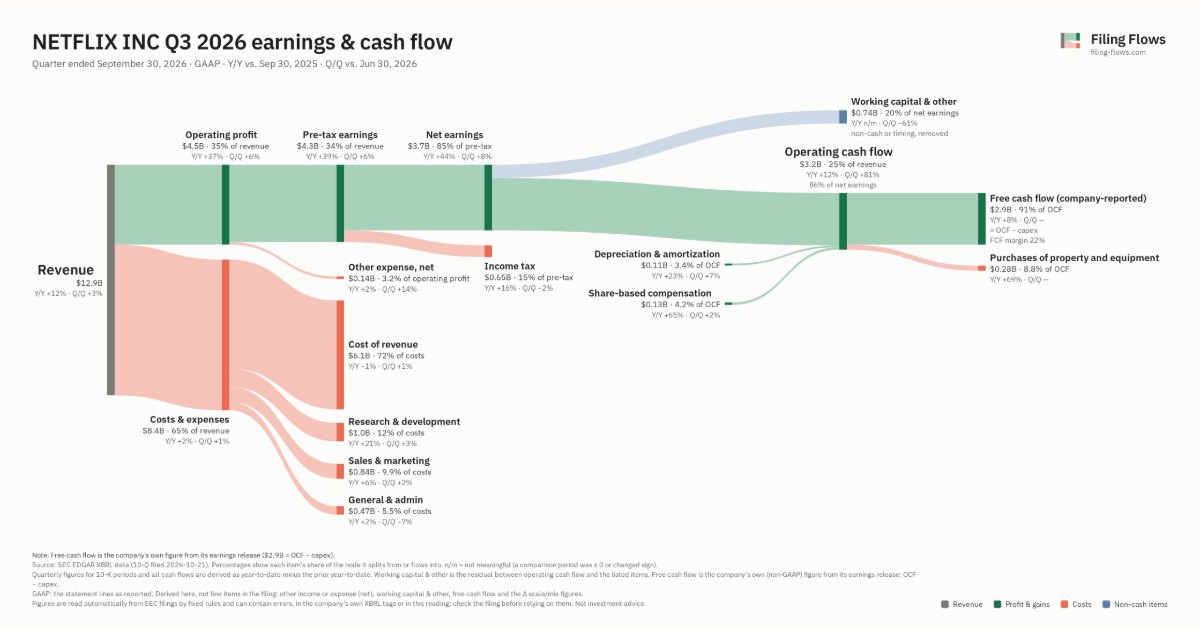
Netflix made $12.9B in Q3 2026 (+12% Y/Y). Operating margin 34.6%, net earnings $3.7B. See where every dollar goes — costs, profit and cash — as a Sankey from the 10-Q filed Oct 21, 2026.
Drawing the Sankey…
Open the interactive Sankey → click any line for what the company wrote about it, compare Y/Y and Q/Q, export as PNG or PDF
What changed this quarter
Revenue was $12.9B in Q3 2026, up 12% year over year and up 3% from the previous quarter.
Operating profit was $4.5B, a 34.6% margin (up 6.4 points year over year). Of the extra revenue versus Q3 2025, 89% reached operating profit, above the 28% margin then. Total costs grew 2% against revenue growth of 12%. The fastest-growing cost line was Research & development (+21%). Net earnings were $3.7B, up 44% year over year. The effective tax rate was 15.1%.
Operating cash flow was $3.2B (up 12% year over year), 86% of net earnings. Non-cash charges added back $0.11B of depreciation and amortization and $0.13B of share-based compensation. Working capital and other items used $0.74B. After purchases of property and equipment ($0.28B), free cash flow as the company reports it was $2.9B.
Quarterly history
| Quarter | Form | Filed | Revenue | Y/Y | Op. margin | Net earnings | Op. cash flow |
|---|---|---|---|---|---|---|---|
| Q3 2026 | 10-Q | Oct 21, 2026 | $12.9B | +12% | 34.6% | $3.7B | $3.2B |
| Q2 2026 | 10-Q | Jul 17, 2026 | $12.6B | +13% | 33.4% | $3.4B | $1.7B |
| Q1 2026 | 10-Q | Apr 17, 2026 | $12.2B | +16% | 32.3% | $5.3B | $5.3B |
| Q4 2025 | 10-K | Jan 23, 2026 | $12.1B | +18% | 24.5% | $2.4B | $2.1B |
| Q3 2025 | 10-Q | Oct 22, 2025 | $11.5B | +17% | 28.2% | $2.5B | $2.8B |
| Q2 2025 | 10-Q | Jul 18, 2025 | $11.1B | +16% | 34.1% | $3.1B | $2.4B |
| Q1 2025 | 10-Q | Apr 18, 2025 | $10.5B | +12% | 31.7% | $2.9B | $2.8B |
Charts
Interactive views
The same charts as the app — open one to draw it.
💵Where each $1 goesinteractive
Loading the interactive chart…
🌏Named in Asian annual reportsinteractive
Loading the interactive chart…
🔄Rotation against the market and its industry (RRG)interactive
Loading the interactive chart…
🔍Earnings qualityinteractive
Loading the interactive chart…
⚖️Fair value by methodinteractive
Loading the interactive chart…
🔭Outlook & guidanceinteractive
Loading the interactive chart…
📈Investments: gains and what it boughtinteractive
Loading the interactive chart…
🏭Its industry’s money flow (input-output)interactive
Loading the interactive chart…
Customers and suppliers named in filings
Buys from
- Hudson Pacific Properties, L.P. — 22% of the supplier’s revenue · Stated in 10-K (sentence) · source
- HPP — 22% of the supplier’s revenue · Stated in 10-K (sentence) · source
- AMZN · Stated in 10-K (named, share not stated) · source
About Netflix
Netflix, Inc. (“Netflix”, the “Company”, “registrant”, “we”, or “us”) is one of the world’s leading entertainment services offering TV series, films, games and live programming across a wide variety of genres and languages. Members can play, pause and resume watching as much as they want, anytime, anywhere, and can change their plans at any time. Our core strategy is to grow our business globally within the parameters of our operating margin target. We strive to continuously improve our members' experience by offering compelling content that delights them and attracts new members. We aim to offer a range of pricing plans, including our ad-supported subscription plan, to meet a variety of consumer needs.
In its own words, from its 10-K, filed Jan 23, 2026.
Netflix against its Services-Video Tape Rental peers
The largest companies of the same SEC industry, each at its latest quarter.
| Company | Quarter | Revenue | Y/Y | Op. margin |
|---|---|---|---|---|
| NFLX Netflix | Q3 2026 | $12.9B | +12% | 34.6% |
| CNVS Cineverse | Q1 FY27 | $30.6M | +175% | -16.7% |
Source: Netflix 10-Q on SEC EDGAR · CIK 1065280 · Services-Video Tape Rental
Guidance and outlook
13F: who owns NFLX and who is buying
More on NFLX
History
Every quarter: Q3 2026 results · Q2 2026 results · Q1 2026 results · Q4 2025 results · Q3 2025 results · Q2 2025 results · Q1 2025 results