Filing Flows › Technology › NetApp (NTAP)
NetApp (NTAP) earnings and revenue breakdown
Latest: Q1 FY27 · 10-Q filed Sep 2, 2026 · NetApp (NTAP) Q1 FY27 earnings results →
Q1 FY27 Revenue up 30% year over year to $1.8B · 21¢ of every $1 of revenue kept as net profit · operating margin 26.6%
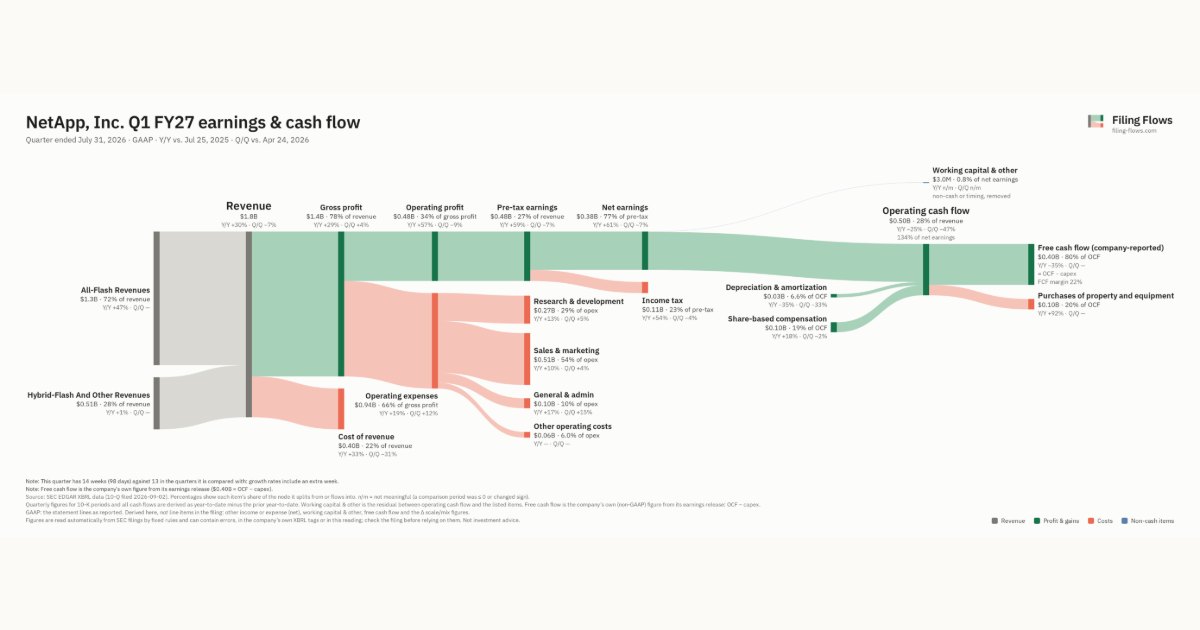
NetApp made $1.8B in Q1 FY27 (+30% Y/Y): All-Flash Revenues $1.3B, Hybrid-Flash and Other Revenues $510M. Operating margin 26.6%, net earnings $375M. See where every dollar goes — costs, profit and cash — as a Sankey from the 10-Q filed Sep 2, 2026.
Drawing the Sankey…
Open the interactive Sankey → click any line for what the company wrote about it, compare Y/Y and Q/Q, export as PNG or PDF
What changed this quarter
Revenue was $1.8B in Q1 FY27, up 30% year over year and down 7% from the previous quarter. All-Flash Revenues was the largest line at 72% of revenue. All-Flash Revenues added $0.42B year over year (up 47%), 99% of the total change.
Gross margin was 78.0%, down 0.5 points from Q1 FY26. Operating profit was $0.48B, a 26.6% margin (up 4.5 points year over year). Of the extra revenue versus Q1 FY26, 42% reached operating profit, above the 22% margin then. Operating expenses grew 19% against revenue growth of 30%. The fastest-growing cost line was General & admin (+17%). Net earnings were $0.38B, up 61% year over year. The effective tax rate was 22.5%.
Operating cash flow was $0.50B (down 25% year over year), 134% of net earnings. Non-cash charges added back $0.03B of depreciation and amortization and $0.10B of share-based compensation. After purchases of property and equipment ($0.10B), free cash flow as the company reports it was $0.40B.
Quarterly history
| Quarter | Form | Filed | Revenue | Y/Y | Op. margin | Net earnings | Op. cash flow |
|---|---|---|---|---|---|---|---|
| Q1 FY27 | 10-Q | Sep 2, 2026 | $1.8B | +30% | 26.6% | $375M | $503M |
| Q4 FY26 | 10-K | Jun 5, 2026 | $1.9B | +12% | 27.3% | $404M | $950M |
| Q3 FY26 | 10-Q | Feb 26, 2026 | $1.7B | +4% | 25.3% | $334M | $317M |
| Q2 FY26 | 10-Q | Nov 25, 2025 | $1.7B | +3% | 23.4% | $305M | $127M |
| Q1 FY26 | 10-Q | Aug 27, 2025 | $1.4B | -9% | 22.1% | $233M | $673M |
| Q4 FY25 | 10-K | Jun 9, 2025 | $1.7B | +4% | 20.1% | $340M | $675M |
| Q3 FY25 | 10-Q | Feb 27, 2025 | $1.6B | +2% | 22.1% | $299M | $385M |
Charts
Interactive views
The same charts as the app — open one to draw it.
💵Where each $1 goesinteractive
Loading the interactive chart…
🌏Named in Asian annual reportsinteractive
Loading the interactive chart…
🔄Rotation against the market and its industry (RRG)interactive
Loading the interactive chart…
🔍Earnings qualityinteractive
Loading the interactive chart…
⚖️Fair value by methodinteractive
Loading the interactive chart…
🔭Outlook & guidanceinteractive
Loading the interactive chart…
📈Investments: gains and what it boughtinteractive
Loading the interactive chart…
🏭Its industry’s money flow (input-output)interactive
Loading the interactive chart…
Customers and suppliers named in filings
Sells to
- ARW — 22% of its revenue · Stated in 10-K (XBRL) · source
- Tech Data Corporation — 21% of its revenue · Stated in 10-K (XBRL) · source
- U.S. government — 11% of its revenue · Stated in 10-K (sentence) · source
About NetApp
NetApp, Inc. (NetApp, we, us, or the Company), headquartered in San Jose, California, is a global leader in Intelligent Data Infrastructure. Since our founding in 1992, we have transformed from a pioneering storage hardware provider into a software-driven, cloud-centric data infrastructure company. Our flagship ONTAP® data management software, together with a comprehensive portfolio of all-flash, hybrid-flash, and cloud-native solutions, forms the backbone of digital transformation for thousands of enterprises worldwide. NetApp empowers organizations to manage, protect, and leverage data across on-premises, hybrid, and multi-cloud environments.
In its own words, from its 10-K, filed Jun 5, 2026.
NetApp against its Computer Storage Devices peers
The largest companies of the same SEC industry, each at its latest quarter. Revenue growth: +30% against the peers' median +56%. Operating margin: 26.6% against the peers' median 46.7%.
| Company | Quarter | Revenue | Y/Y | Op. margin |
|---|---|---|---|---|
| NTAP NetApp | Q1 FY27 | $1.8B | +30% | 26.6% |
| SNDK Sandisk | Q1 FY27 | $11.0B | +378% | 79.6% |
| WDC Western Digital | Q1 FY27 | $4.4B | +56% | 46.7% |
| STX Seagate Technology Holdings | Q1 FY27 | $4.2B | +61% | 48.8% |
| P Everpure | Q2 FY27 | $1.2B | +38% | 5.3% |
| QMCO Quantum | Q1 FY27 | $80.8M | +26% | 6.2% |
Source: NetApp 10-Q on SEC EDGAR · CIK 1002047 · Computer Storage Devices
Guidance and outlook
13F: who owns NTAP and who is buying
More on NTAP
History
Every quarter: Q1 FY27 results · Q4 FY26 results · Q3 FY26 results · Q2 FY26 results · Q1 FY26 results · Q4 FY25 results · Q3 FY25 results