Filing Flows › Technology › Everpure (P)
Everpure (P) earnings and revenue breakdown
Latest: Q2 FY27 · 10-Q filed Sep 4, 2026 · Everpure (P) Q2 FY27 earnings results →
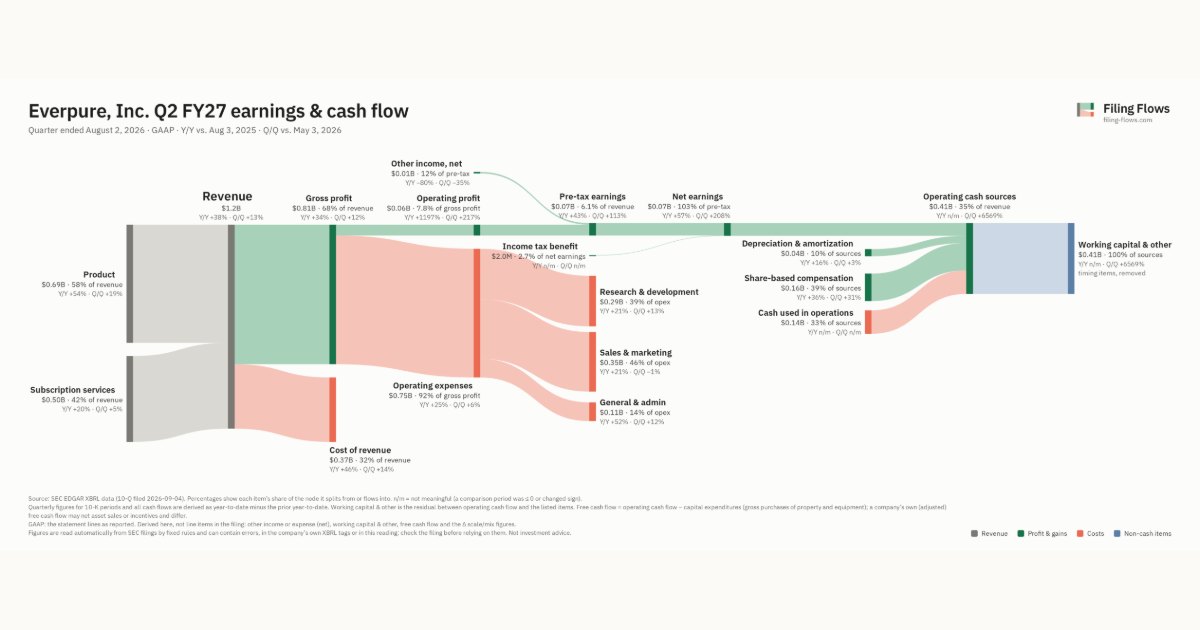
Q2 FY27 Revenue up 38% year over year to $1.2B · 6¢ of every $1 of revenue kept as net profit · operating margin 5.3%
Everpure made $1.2B in Q2 FY27 (+38% Y/Y): Product $687M, Subscription services $499M. Operating margin 5.3%, net earnings $74.1M. See where every dollar goes — costs, profit and cash — as a Sankey from the 10-Q filed Sep 4, 2026.
Drawing the Sankey…
Open the interactive Sankey → click any line for what the company wrote about it, compare Y/Y and Q/Q, export as PNG or PDF
What changed this quarter
Revenue was $1.2B in Q2 FY27, up 38% year over year and up 13% from the previous quarter. Product was the largest line at 58% of revenue. Product added $0.24B year over year (up 54%), 74% of the total change.
Gross margin was 68.4%, down 1.8 points from Q2 FY26. Operating profit was $0.06B, a 5.3% margin (up 4.8 points year over year). Of the extra revenue versus Q2 FY26, 18% reached operating profit, above the 1% margin then. Operating expenses grew 25% against revenue growth of 38%. The fastest-growing cost line was General & admin (+52%). Net earnings were $0.07B, up 57% year over year. The effective tax rate was -2.8%.
Operating cash flow was −$0.14B. Non-cash charges added back $0.04B of depreciation and amortization and $0.16B of share-based compensation. Working capital and other items used $0.41B. Capital expenditures of $0.10B exceeded it, leaving free cash flow of −$0.24B.
Quarterly history
| Quarter | Form | Filed | Revenue | Y/Y | Op. margin | Net earnings | Op. cash flow |
|---|---|---|---|---|---|---|---|
| Q2 FY27 | 10-Q | Sep 4, 2026 | $1.2B | +38% | 5.3% | $74.1M | −$136M |
| Q1 FY27 | 10-Q | Jun 5, 2026 | $1.1B | +35% | 1.9% | $24.1M | $180M |
| Q4 FY26 | 10-K | Mar 25, 2026 | $1.1B | +20% | 8.2% | $100M | $268M |
| Q3 FY26 | 10-Q | Dec 10, 2025 | $964M | +16% | 5.6% | $54.8M | $116M |
| Q2 FY26 | 10-Q | Sep 10, 2025 | $861M | +13% | 0.6% | $47.1M | $212M |
| Q1 FY26 | 10-Q | Jun 11, 2025 | $778M | +12% | -4.0% | −$14.0M | $284M |
| Q4 FY25 | 10-K | Mar 27, 2025 | $880M | +11% | 4.8% | $42.4M | $209M |
Charts
In supply chains and themes
Interactive views
The same charts as the app — open one to draw it.
💵Where each $1 goesinteractive
Loading the interactive chart…
🌏Named in Asian annual reportsinteractive
Loading the interactive chart…
🔄Rotation against the market and its industry (RRG)interactive
Loading the interactive chart…
🔍Earnings qualityinteractive
Loading the interactive chart…
⚖️Fair value by methodinteractive
Loading the interactive chart…
🔭Outlook & guidanceinteractive
Loading the interactive chart…
📈Investments: gains and what it boughtinteractive
Loading the interactive chart…
🏭Its industry’s money flow (input-output)interactive
Loading the interactive chart…
About Everpure
Everpure, formerly known as Pure Storage, is a global technology company providing an integrated storage and data management platform. Data is foundational to our customers’ business transformation and increasingly central to their operational resilience and competitive differentiation. As data volumes expand and artificial intelligence (AI) becomes more deeply embedded in customers' operations, the ability to store, manage, govern, and derive greater value from their data is becoming as important as the infrastructure used to store it.
In its own words, from its 10-K, filed Mar 25, 2026.
Everpure against its Computer Storage Devices peers
The largest companies of the same SEC industry, each at its latest quarter. Revenue growth: +38% against the peers' median +56%. Operating margin: 5.3% against the peers' median 46.7%.
| Company | Quarter | Revenue | Y/Y | Op. margin |
|---|---|---|---|---|
| P Everpure | Q2 FY27 | $1.2B | +38% | 5.3% |
| SNDK Sandisk | Q1 FY27 | $11.0B | +378% | 79.6% |
| WDC Western Digital | Q1 FY27 | $4.4B | +56% | 46.7% |
| STX Seagate Technology Holdings | Q1 FY27 | $4.2B | +61% | 48.8% |
| NTAP NetApp | Q1 FY27 | $1.8B | +30% | 26.6% |
| QMCO Quantum | Q1 FY27 | $80.8M | +26% | 6.2% |
Source: Everpure 10-Q on SEC EDGAR · CIK 1474432 · Computer Storage Devices
13F: who owns P and who is buying
More on P
History
Every quarter: Q2 FY27 results · Q1 FY27 results · Q4 FY26 results · Q3 FY26 results · Q2 FY26 results · Q1 FY26 results · Q4 FY25 results