Filing Flows › Technology › On Semiconductor (ON)
On Semiconductor (ON) earnings and revenue breakdown
Latest: Q3 2026 · 10-Q filed Nov 2, 2026 · On Semiconductor (ON) Q3 2026 earnings results →
Q3 2026 Revenue up 11% year over year to $1.7B · 18¢ of every $1 of revenue kept as net profit · operating margin 22.0%
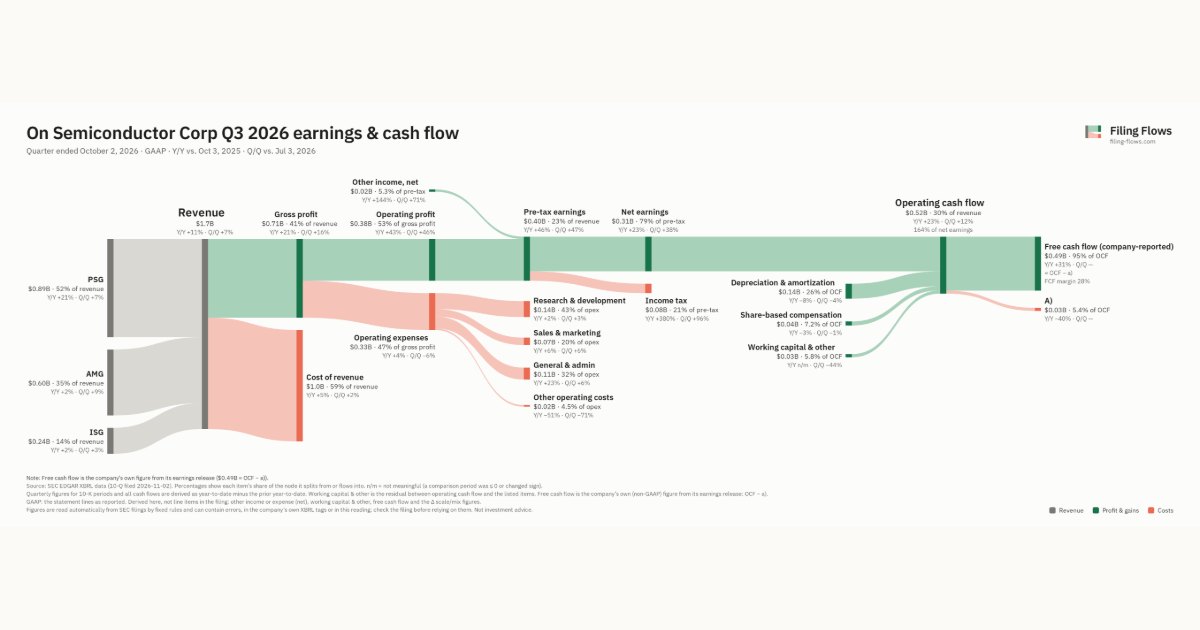
On Semiconductor made $1.7B in Q3 2026 (+11% Y/Y): PSG $890M, AMG $597M, ISG $235M. Operating margin 22.0%, net earnings $314M. See where every dollar goes — costs, profit and cash — as a Sankey from the 10-Q filed Nov 2, 2026.
Drawing the Sankey…
Open the interactive Sankey → click any line for what the company wrote about it, compare Y/Y and Q/Q, export as PNG or PDF
What changed this quarter
Revenue was $1.7B in Q3 2026, up 11% year over year and up 7% from the previous quarter. PSG was the largest line at 52% of revenue. PSG added $0.15B year over year (up 21%), 89% of the total change.
Gross margin was 41.4%, up 3.5 points from Q3 2025. Operating profit was $0.38B, a 22.0% margin (up 4.9 points year over year). Of the extra revenue versus Q3 2025, 66% reached operating profit, above the 17% margin then. Operating expenses grew 4% against revenue growth of 11%. The fastest-growing cost line was General & admin (+23%). Net earnings were $0.31B, up 23% year over year. The effective tax rate was 21.3%.
Operating cash flow was $0.52B (up 23% year over year), 164% of net earnings. Non-cash charges added back $0.14B of depreciation and amortization and $0.04B of share-based compensation. Working capital and other items added $0.03B. After a) ($0.03B), free cash flow as the company reports it was $0.49B.
Quarterly history
| Quarter | Form | Filed | Revenue | Y/Y | Op. margin | Net earnings | Op. cash flow |
|---|---|---|---|---|---|---|---|
| Q3 2026 | 10-Q | Nov 2, 2026 | $1.7B | +11% | 22.0% | $314M | $516M |
| Q2 2026 | 10-Q | Aug 3, 2026 | $1.6B | +9% | 16.1% | $228M | $460M |
| Q1 2026 | 10-Q | May 4, 2026 | $1.5B | +5% | -3.5% | −$32.9M | $239M |
| Q4 2025 | 10-K | Feb 9, 2026 | $1.5B | -11% | 13.1% | $182M | $554M |
| Q3 2025 | 10-Q | Nov 3, 2025 | $1.6B | -12% | 17.0% | $255M | $419M |
| Q2 2025 | 10-Q | Aug 4, 2025 | $1.5B | -15% | 13.2% | $172M | $184M |
| Q1 2025 | 10-Q | May 5, 2025 | $1.4B | -22% | -39.7% | −$485M | $602M |
Charts
Interactive views
The same charts as the app — open one to draw it.
💵Where each $1 goesinteractive
Loading the interactive chart…
🌏Named in Asian annual reportsinteractive
Loading the interactive chart…
🔄Rotation against the market and its industry (RRG)interactive
Loading the interactive chart…
🔍Earnings qualityinteractive
Loading the interactive chart…
⚖️Fair value by methodinteractive
Loading the interactive chart…
🔭Outlook & guidanceinteractive
Loading the interactive chart…
📈Investments: gains and what it boughtinteractive
Loading the interactive chart…
🏭Its industry’s money flow (input-output)interactive
Loading the interactive chart…
About On Semiconductor
ON Semiconductor Corporation, together with its wholly and majority-owned subsidiaries, which operate under the onsemi TM brand ("onsemi," "we," "us," "our," or the "Company"), was incorporated under the laws of the State of Delaware in 1992. We offer intelligent power and intelligent sensing solutions that drive electrification, energy efficiency, safety, and automation in automotive, industrial, and other end-markets, including AI data center. Our intelligent power technologies enable the electrification of drivetrain in the automotive industry to allow for lighter and longer-range electric vehicles and empower efficient fast-charging systems. Our intelligent sensing technologies enable advanced safety applications in automotive through industry leading performance and reliability.
In its own words, from its 10-K, filed Feb 9, 2026.
On Semiconductor against its Semiconductors & Related Devices peers
The largest companies of the same SEC industry, each at its latest quarter. Revenue growth: +11% against the peers' median +40%. Operating margin: 22.0% against the peers' median 40.1%.
| Company | Quarter | Revenue | Y/Y | Op. margin |
|---|---|---|---|---|
| ON On Semiconductor | Q3 2026 | $1.7B | +11% | 22.0% |
| NVDA NVIDIA | Q2 FY27 | $96.2B | +106% | 66.2% |
| MU Micron Technology | Q4 FY26 | $54.2B | +379% | 80.7% |
| AVGO Broadcom | Q3 FY26 | $29.6B | +86% | 53.9% |
| INTC Intel | Q3 2026 | $16.5B | +21% | 15.3% |
| AMD Advanced Micro Devices | Q3 2026 | $13.4B | +45% | 21.2% |
| AMAT Applied Materials | Q3 FY26 | $9.1B | +25% | 33.7% |
| TXN Texas Instruments | Q3 2026 | $6.1B | +28% | 47.5% |
| ADI Analog Devices | Q3 FY26 | $4.0B | +40% | 40.1% |
Source: On Semiconductor 10-Q on SEC EDGAR · CIK 1097864 · Semiconductors & Related Devices
Guidance and outlook
13F: who owns ON and who is buying
More on ON
- How On Semiconductor makes money: revenue by segment
- On Semiconductor next earnings date and what analysts expect
- On Semiconductor stock forecast, price target and fair value
- Who owns On Semiconductor stock: holders, funds and Congress trades
- On Semiconductor guidance and outlook
- Is On Semiconductor a takeover target? LBO and rumors
- On Semiconductor recalls, complaints and regulation
History
Every quarter: Q3 2026 results · Q2 2026 results · Q1 2026 results · Q4 2025 results · Q3 2025 results · Q2 2025 results · Q1 2025 results
- On Semiconductor guidance history: guided vs reported
- On Semiconductor gross margin by quarter
- On Semiconductor operating margin by quarter
- On Semiconductor net income by quarter
- On Semiconductor free cash flow by quarter
- On Semiconductor R&D spending by quarter
- On Semiconductor PSG revenue by quarter
- On Semiconductor AMG revenue by quarter
- On Semiconductor ISG revenue by quarter