Filing Flows › Health Care › BeOne Medicines (ONC)
BeOne Medicines (ONC) earnings and revenue breakdown
Latest: Q3 2026 · 10-Q filed Nov 5, 2026 · BeOne Medicines (ONC) Q3 2026 earnings results →
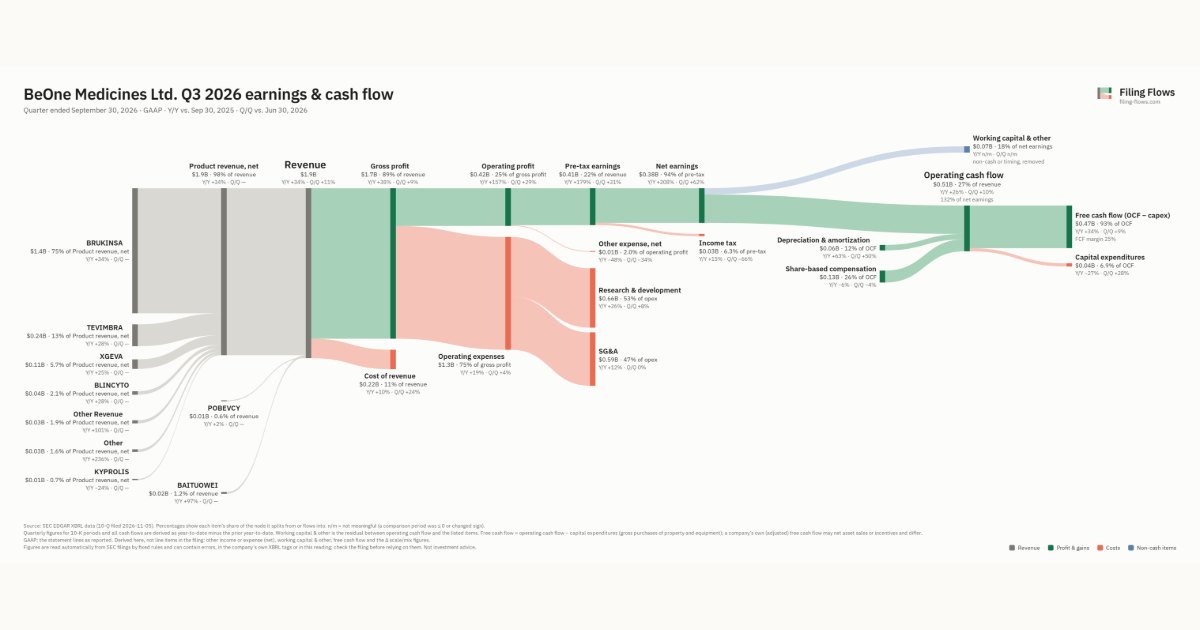
Q3 2026 Revenue up 34% year over year to $1.9B · 20¢ of every $1 of revenue kept as net profit · operating margin 22.2%
BeOne Medicines made $1.9B in Q3 2026 (+34% Y/Y): Product revenue, net $1.9B, BAITUOWEI $22.1M, POBEVCY $10.7M. Operating margin 22.2%, net earnings $385M. See where every dollar goes — costs, profit and cash — as a Sankey from the 10-Q filed Nov 5, 2026.
Drawing the Sankey…
Open the interactive Sankey → click any line for what the company wrote about it, compare Y/Y and Q/Q, export as PNG or PDF
What changed this quarter
Revenue was $1.9B in Q3 2026, up 34% year over year and up 11% from the previous quarter. BRUKINSA was the largest line at 74% of revenue. BRUKINSA added $0.35B year over year (up 34%), 73% of the total change. KYPROLIS declined 24%.
Gross margin was 88.5%, up 2.4 points from Q3 2025. Operating profit was $0.42B, a 22.2% margin (up 10.6 points year over year). Of the extra revenue versus Q3 2025, 54% reached operating profit, above the 12% margin then. Operating expenses grew 19% against revenue growth of 34%. The fastest-growing cost line was Research & development (+26%). Net earnings were $0.38B, up 208% year over year. The effective tax rate was 6.3%.
Operating cash flow was $0.51B (up 26% year over year), 132% of net earnings. Non-cash charges added back $0.06B of depreciation and amortization and $0.13B of share-based compensation. Working capital and other items used $0.07B. Capital expenditures of $0.04B left free cash flow of $0.47B.
Quarterly history
| Quarter | Form | Filed | Revenue | Y/Y | Op. margin | Net earnings | Op. cash flow |
|---|---|---|---|---|---|---|---|
| Q3 2026 | 10-Q | Nov 5, 2026 | $1.9B | +34% | 22.2% | $385M | $509M |
| Q2 2026 | 10-Q | Aug 5, 2026 | $1.7B | +30% | 19.1% | $237M | $463M |
| Q1 2026 | 10-Q | May 6, 2026 | $1.5B | +36% | 16.5% | $227M | $201M |
| Q4 2025 | 10-K | Feb 26, 2026 | $1.5B | +33% | 12.4% | $66.5M | $417M |
| Q3 2025 | 10-Q | Nov 6, 2025 | $1.4B | +41% | 11.5% | $125M | $403M |
| Q2 2025 | 10-Q | Aug 6, 2025 | $1.3B | +42% | 6.7% | $94.3M | $264M |
| Q1 2025 | 10-Q | May 7, 2025 | $1.1B | +49% | 1.0% | $1.3M | $44.1M |
Charts
Interactive views
The same charts as the app — open one to draw it.
💵Where each $1 goesinteractive
Loading the interactive chart…
🌏Named in Asian annual reportsinteractive
Loading the interactive chart…
🔄Rotation against the market and its industry (RRG)interactive
Loading the interactive chart…
🔍Earnings qualityinteractive
Loading the interactive chart…
⚖️Fair value by methodinteractive
Loading the interactive chart…
🔭Outlook & guidanceinteractive
Loading the interactive chart…
📈Investments: gains and what it boughtinteractive
Loading the interactive chart…
🏭Its industry’s money flow (input-output)interactive
Loading the interactive chart…
Customers and suppliers named in filings
Sells to
- MCK — 18% of its revenue · Stated in 10-K (XBRL) · source
- COR · Stated in 10-K (named, share not stated) · source
About BeOne Medicines
We are a leading global oncology company discovering and developing innovative treatments that are more accessible to cancer patients worldwide. In 2025, we generated total global revenue of approximately $5.3 billion, increasing revenue by approximately 40.2% from the prior year, while achieving net income of $286.9 million, net cash provided by operating activities of $1.1 billion and positive free cash flow of $941.7 million. We are serial innovators in hematology and have built a differentiated, wholly-owned, and foundational franchise. We are the only company with potentially best-in-class assets across three foundational chronic lymphocytic leukemia (“CLL”) mechanisms of action (“MoAs”).
In its own words, from its 10-K, filed Feb 26, 2026.
BeOne Medicines against its Pharmaceutical Preparations peers
The largest companies of the same SEC industry, each at its latest quarter. Revenue growth: +34% against the peers' median +10%. Operating margin: 22.2% against the peers' median 22.2%.
| Company | Quarter | Revenue | Y/Y | Op. margin |
|---|---|---|---|---|
| ONC BeOne Medicines | Q3 2026 | $1.9B | +34% | 22.2% |
| JNJ Johnson & Johnson | Q3 2026 | $25.4B | +6% | 0.1% |
| LLY ELI Lilly | Q3 2026 | $24.4B | +39% | 34.5% |
| MRK Merck | Q3 2026 | $18.1B | +5% | 30.7% |
| ABBV AbbVie | Q3 2026 | $17.4B | +10% | 36.0% |
| PFE Pfizer | Q3 2026 | $16.6B | -0.4% | 20.4% |
| BMY Bristol Myers Squibb | Q3 2026 | $13.1B | +7% | 19.4% |
| ABT Abbott Laboratories | Q3 2026 | $13.0B | +14% | 10.4% |
| REGN Regeneron Pharmaceuticals | Q3 2026 | $5.1B | +36% | 40.0% |
Source: BeOne Medicines 10-Q on SEC EDGAR · CIK 1651308 · Pharmaceutical Preparations
Guidance and outlook
13F: who owns ONC and who is buying
More on ONC
- How BeOne Medicines makes money: revenue by segment
- BeOne Medicines next earnings date and what analysts expect
- BeOne Medicines stock forecast, price target and fair value
- Who owns BeOne Medicines stock: holders, funds and Congress trades
- BeOne Medicines guidance and outlook
- Is BeOne Medicines a takeover target? LBO and rumors
- BeOne Medicines recalls, complaints and regulation
History
Every quarter: Q3 2026 results · Q2 2026 results · Q1 2026 results · Q4 2025 results · Q3 2025 results · Q2 2025 results · Q1 2025 results