Filing Flows › Health Care › Pacs Group (PACS)
Pacs Group (PACS) earnings and revenue breakdown
Latest: Q3 2026 · 10-Q filed Nov 3, 2026 · Pacs Group (PACS) Q3 2026 earnings results →
Q3 2026 Revenue up 12% year over year to $1.5B · 4¢ of every $1 of revenue kept as net profit · operating margin 6.7%
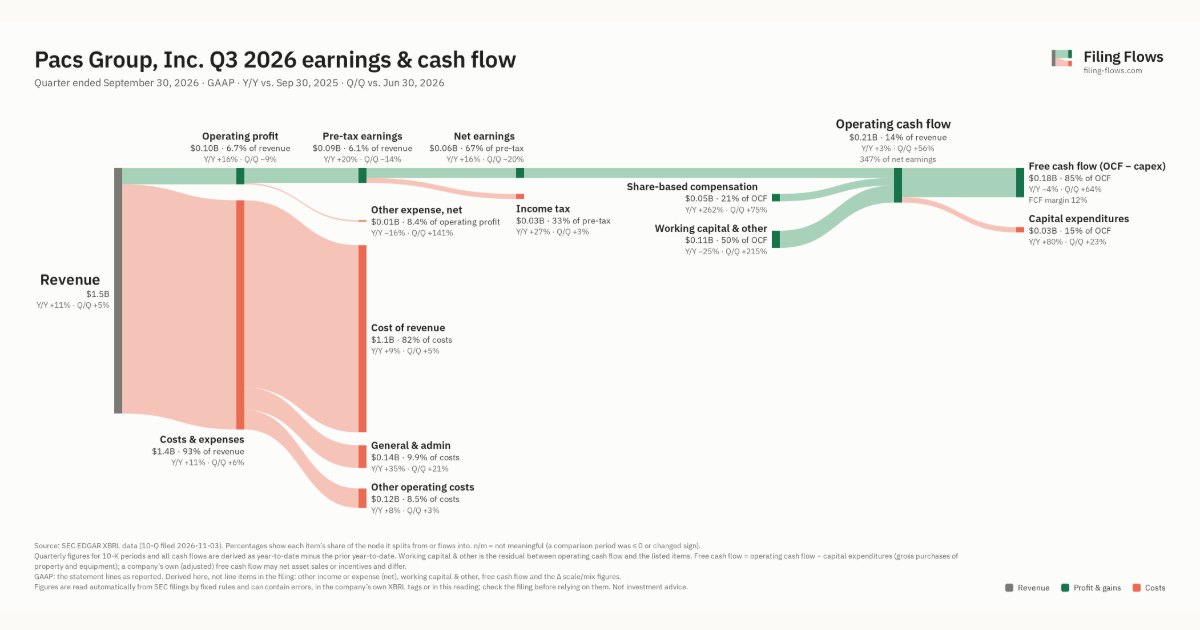
Pacs Group made $1.5B in Q3 2026 (+12% Y/Y). Operating margin 6.7%, net earnings $60.8M. See where every dollar goes — costs, profit and cash — as a Sankey from the 10-Q filed Nov 3, 2026.
Drawing the Sankey…
Open the interactive Sankey → click any line for what the company wrote about it, compare Y/Y and Q/Q, export as PNG or PDF
What changed this quarter
Revenue was $1.5B in Q3 2026, up 11% year over year and up 5% from the previous quarter.
Operating profit was $0.10B, a 6.7% margin (up 0.2 points year over year). Of the extra revenue versus Q3 2025, 9% reached operating profit, above the 6% margin then. Total costs grew 11% against revenue growth of 11%. The fastest-growing cost line was General & admin (+35%). Net earnings were $0.06B, up 16% year over year. The effective tax rate was 33.4%.
Operating cash flow was $0.21B (up 3% year over year), 347% of net earnings. Non-cash charges added back $0.05B of share-based compensation. Working capital and other items added $0.11B. Capital expenditures of $0.03B left free cash flow of $0.18B.
Quarterly history
| Quarter | Form | Filed | Revenue | Y/Y | Op. margin | Net earnings | Op. cash flow |
|---|---|---|---|---|---|---|---|
| Q3 2026 | 10-Q | Nov 3, 2026 | $1.5B | +12% | 6.7% | $60.8M | $211M |
| Q2 2026 | 10-Q | Aug 4, 2026 | $1.4B | +9% | 7.7% | $76.3M | $136M |
| Q1 2026 | 10-Q | May 11, 2026 | $1.4B | +11% | 8.5% | $80.7M | $236M |
| Q4 2025 | 10-K | Feb 27, 2026 | $1.4B | +12% | 7.0% | $59.8M | −$3.4M |
| Q3 2025 | 10-Q | Nov 19, 2025 | $1.3B | +31% | 6.4% | $52.3M | $205M |
| Q2 2025 | 10-Q | Nov 19, 2025 | $1.3B | +40% | 6.1% | $51.0M | $52.6M |
| Q1 2025 | 10-Q | Nov 19, 2025 | $1.3B | +39% | 3.8% | $28.4M | $150M |
Charts
Interactive views
The same charts as the app — open one to draw it.
💵Where each $1 goesinteractive
Loading the interactive chart…
🌏Named in Asian annual reportsinteractive
Loading the interactive chart…
🔄Rotation against the market and its industry (RRG)interactive
Loading the interactive chart…
🔍Earnings qualityinteractive
Loading the interactive chart…
⚖️Fair value by methodinteractive
Loading the interactive chart…
🔭Outlook & guidanceinteractive
Loading the interactive chart…
📈Investments: gains and what it boughtinteractive
Loading the interactive chart…
🏭Its industry’s money flow (input-output)interactive
Loading the interactive chart…
Customers and suppliers named in filings
Sells to
- Medicare & Medicaid — 40% of its revenue · Stated in 10-K (sentence) · source
About Pacs Group
We are a leading post-acute healthcare company primarily focused on delivering high-quality skilled nursing care through a portfolio of independently operated facilities. Founded in 2013, we are one of the largest skilled nursing providers in the United States based on number of facilities. We also provide senior care, assisted living, and independent living options in some of our communities. In total, we operate 321 post-acute care facilities across 17 states serving over 31,700 patients daily. Our significant historical growth has been primarily driven by our expertise in acquiring underperforming long-term custodial care skilled nursing facilities and transforming them into higher acuity, high value-add short-term transitional care skilled nursing facilities.
In its own words, from its 10-K, filed Feb 27, 2026.
Pacs Group against its Services-Skilled Nursing Care Facilities peers
The largest companies of the same SEC industry, each at its latest quarter. Revenue growth: +12% against the peers' median +12%. Operating margin: 6.7% against the peers' median 9.3%.
| Company | Quarter | Revenue | Y/Y | Op. margin |
|---|---|---|---|---|
| PACS Pacs Group | Q3 2026 | $1.5B | +12% | 6.7% |
| ENSG Ensign Group | Q3 2026 | $1.5B | +14% | 9.3% |
| NHC National Healthcare | Q3 2026 | $408M | +7% | 10.0% |
Source: Pacs Group 10-Q on SEC EDGAR · CIK 2001184 · Services-Skilled Nursing Care Facilities
Guidance and outlook
13F: who owns PACS and who is buying
More on PACS
History
Every quarter: Q3 2026 results · Q2 2026 results · Q1 2026 results · Q4 2025 results · Q3 2025 results · Q2 2025 results · Q1 2025 results