Filing Flows › Financials › Pinnacle Financial Partners (PNFP)
Pinnacle Financial Partners (PNFP) earnings and revenue breakdown
Latest: Q3 2026 · 10-Q filed Nov 2, 2026 · Pinnacle Financial Partners (PNFP) Q3 2026 earnings results →
Q3 2026 Revenue up 141% year over year to $1.3B · 29¢ of every $1 of revenue kept as net profit · operating margin 36.4%
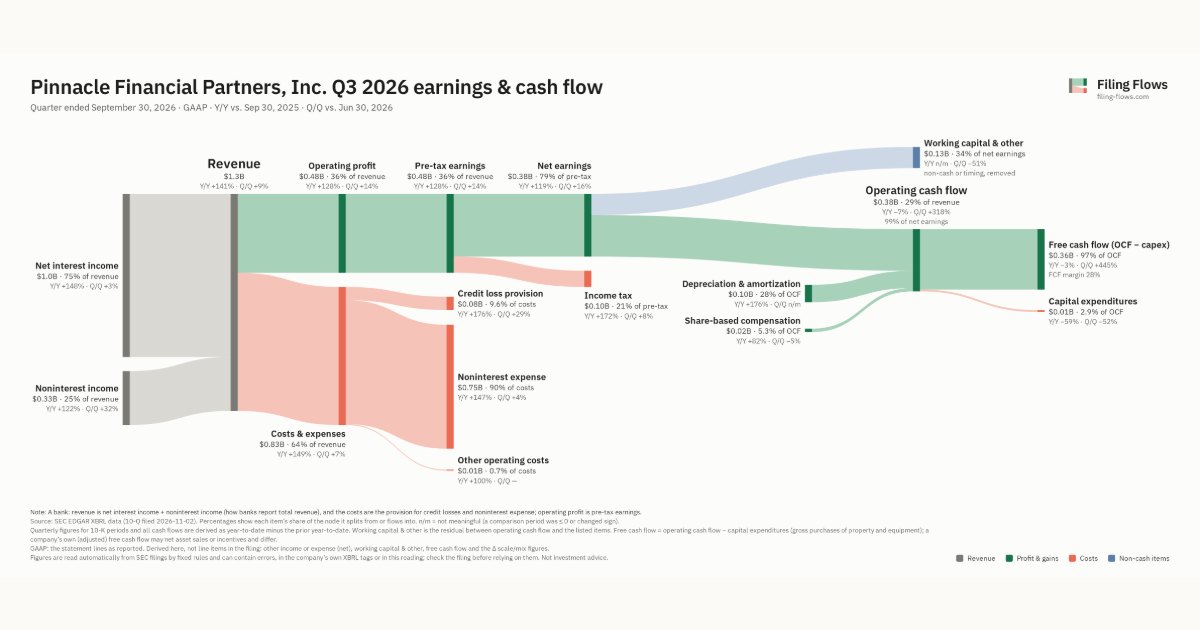
Pinnacle Financial Partners made $1.3B in Q3 2026 (+141% Y/Y): Net interest income $986M, Noninterest income $326M. Operating margin 36.4%, net earnings $379M. See where every dollar goes — costs, profit and cash — as a Sankey from the 10-Q filed Nov 2, 2026.
Drawing the Sankey…
Open the interactive Sankey → click any line for what the company wrote about it, compare Y/Y and Q/Q, export as PNG or PDF
What changed this quarter
Revenue was $1.3B in Q3 2026, up 141% year over year and up 9% from the previous quarter. Net interest income was the largest line at 75% of revenue. Net interest income added $0.59B year over year (up 148%), 77% of the total change.
Operating profit was $0.48B, a 36.4% margin (down 2.1 points year over year). Of the extra revenue versus a year earlier, 35% reached operating profit, below the 38% margin then. Total costs grew 149% against revenue growth of 141%. The fastest-growing cost line was Credit loss provision (+176%). Net earnings were $0.38B, up 119% year over year. The effective tax rate was 20.5%.
Operating cash flow was $0.38B (down 7% year over year), 99% of net earnings. Non-cash charges added back $0.10B of depreciation and amortization and $0.02B of share-based compensation. Working capital and other items used $0.13B. Capital expenditures of $0.01B left free cash flow of $0.36B.
Quarterly history
| Quarter | Form | Filed | Revenue | Y/Y | Op. margin | Net earnings | Op. cash flow |
|---|---|---|---|---|---|---|---|
| Q3 2026 | 10-Q | Nov 2, 2026 | $1.3B | +141% | 36.4% | $379M | $376M |
| Q4 2025 | 10-K | Mar 2, 2026 | $543M | — | 37.7% | $169M | $116M |
Charts
Interactive views
The same charts as the app — open one to draw it.
💵Where each $1 goesinteractive
Loading the interactive chart…
🌏Named in Asian annual reportsinteractive
Loading the interactive chart…
🔄Rotation against the market and its industry (RRG)interactive
Loading the interactive chart…
🔍Earnings qualityinteractive
Loading the interactive chart…
⚖️Fair value by methodinteractive
Loading the interactive chart…
🔭Outlook & guidanceinteractive
Loading the interactive chart…
📈Investments: gains and what it boughtinteractive
Loading the interactive chart…
🏭Its industry’s money flow (input-output)interactive
Loading the interactive chart…
About Pinnacle Financial Partners
Pinnacle Financial Partners is a financial holding company headquartered in Nashville, Tennessee, with approximately $57.7 billion in total assets as of December 31, 2025. At December 31, 2025, the holding company was the parent company of Pinnacle Bank, a Tennessee state-chartered bank, and owned 100% of the capital stock of Pinnacle Bank. The firm started operations on October 27, 2000, in Nashville, Tennessee, and, as of December 31, 2025, had grown through a combination of acquisitions and organic growth to 141 offices from which it conduct branch banking operations, including 50 in Tennessee, 42 in North Carolina, 21 in South Carolina, 10 in Virginia, five in Georgia, six in Alabama, three in Kentucky, two in Maryland and two in Florida.
In its own words, from its 10-K, filed Mar 2, 2026.
Pinnacle Financial Partners against its National Commercial Banks peers
The largest companies of the same SEC industry, each at its latest quarter. Revenue growth: +141% against the peers' median +8%. Operating margin: 36.4% against the peers' median 32.5%.
| Company | Quarter | Revenue | Y/Y | Op. margin |
|---|---|---|---|---|
| PNFP Pinnacle Financial Partners | Q3 2026 | $1.3B | +141% | 36.4% |
| JPM JPMorgan Chase | Q3 2026 | $50.2B | +8% | 40.1% |
| BAC Bank of America | Q3 2026 | $30.0B | +3% | 29.9% |
| C Citigroup | Q3 2026 | $23.8B | +8% | 30.6% |
| WFC Wells Fargo | Q3 2026 | $21.9B | +2% | 32.5% |
| COF Capital One Financial | Q3 2026 | $16.3B | +6% | 28.0% |
| USB US Bancorp | Q3 2026 | $8.0B | +9% | 35.1% |
| PNC PNC Financial Services Group | Q3 2026 | $6.6B | +11% | 40.0% |
| TFC Truist Financial | Q3 2026 | $3.7B | -28% | 23.9% |
Source: Pinnacle Financial Partners 10-Q on SEC EDGAR · CIK 2082866 · National Commercial Banks
Guidance and outlook
13F: who owns PNFP and who is buying
More on PNFP
- How Pinnacle Financial Partners makes money: revenue by segment
- Pinnacle Financial Partners stock forecast, price target and fair value
- Who owns Pinnacle Financial Partners stock: holders, funds and Congress trades
- Pinnacle Financial Partners guidance and outlook
- Pinnacle Financial Partners recalls, complaints and regulation
History
Every quarter: Q3 2026 results · Q4 2025 results