Filing Flows › Technology › Qnity Electronics (Q)
Qnity Electronics (Q) earnings and revenue breakdown
Latest: Q3 2026 · 10-Q filed Nov 4, 2026 · Qnity Electronics (Q) Q3 2026 earnings results →
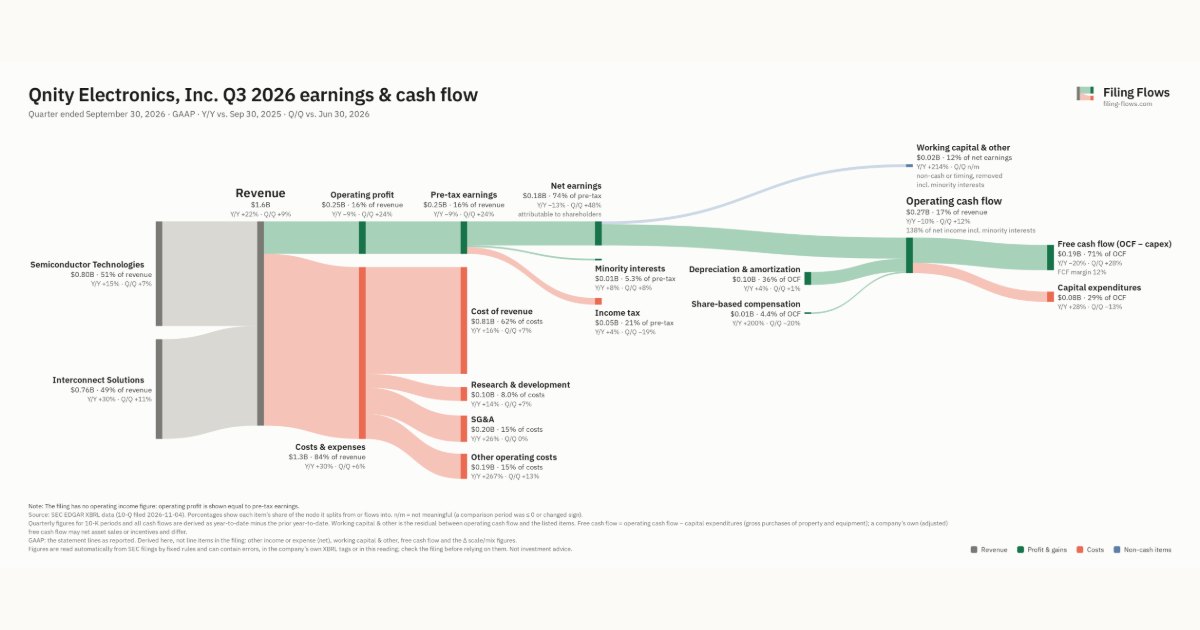
Q3 2026 Revenue up 22% year over year to $1.6B · 12¢ of every $1 of revenue kept as net profit · operating margin 15.9%
Qnity Electronics made $1.6B in Q3 2026 (+22% Y/Y): Semiconductor Technologies $797M, Interconnect Solutions $759M. Operating margin 15.9%, net earnings $183M. See where every dollar goes — costs, profit and cash — as a Sankey from the 10-Q filed Nov 4, 2026.
Drawing the Sankey…
Open the interactive Sankey → click any line for what the company wrote about it, compare Y/Y and Q/Q, export as PNG or PDF
What changed this quarter
Revenue was $1.6B in Q3 2026, up 22% year over year and up 9% from the previous quarter. Semiconductor Technologies was the largest line at 51% of revenue. Interconnect Solutions added $0.18B year over year (up 30%), 63% of the total change.
Operating profit was $0.25B, a 15.9% margin (down 5.4 points year over year). Operating profit fell $0.03B even though revenue rose $0.28B versus Q3 2025, so costs grew faster than sales. Total costs grew 30% against revenue growth of 22%. The fastest-growing cost line was Other operating costs (+267%). Net earnings were $0.18B, down 13% year over year. The effective tax rate was 20.6%.
Operating cash flow was $0.27B (down 10% year over year), 138% of net income including minority interests. Non-cash charges added back $0.10B of depreciation and amortization and $0.01B of share-based compensation. Working capital and other items used $0.04B. Capital expenditures of $0.08B left free cash flow of $0.19B.
Quarterly history
| Quarter | Form | Filed | Revenue | Y/Y | Op. margin | Net earnings | Op. cash flow |
|---|---|---|---|---|---|---|---|
| Q3 2026 | 10-Q | Nov 4, 2026 | $1.6B | +22% | 15.9% | $183M | $271M |
| Q2 2026 | 10-Q | Aug 4, 2026 | $1.4B | +22% | 13.9% | $124M | $241M |
| Q1 2026 | 10-Q | May 12, 2026 | $1.3B | +18% | 16.6% | $151M | $135M |
| Q4 2025 | 10-K | Feb 26, 2026 | $1.2B | +8% | 15.9% | $100M | $491M |
| Q3 2025 | 10-Q | Nov 18, 2025 | $1.3B | +11% | 21.3% | $211M | $302M |
Charts
Interactive views
The same charts as the app — open one to draw it.
💵Where each $1 goesinteractive
Loading the interactive chart…
🌏Named in Asian annual reportsinteractive
Loading the interactive chart…
🔄Rotation against the market and its industry (RRG)interactive
Loading the interactive chart…
🔍Earnings qualityinteractive
Loading the interactive chart…
⚖️Fair value by methodinteractive
Loading the interactive chart…
🔭Outlook & guidanceinteractive
Loading the interactive chart…
📈Investments: gains and what it boughtinteractive
Loading the interactive chart…
🏭Its industry’s money flow (input-output)interactive
Loading the interactive chart…
Customers and suppliers named in filings
Sells to
- Samsung Electronics Co., Ltd — 11% of its revenue · Stated in 10-K (sentence) · source
- TSM — 8% of its revenue · Stated in 10-K (sentence) · source
About Qnity Electronics
Qnity is one of the largest global leaders in materials and solutions for the semiconductor and electronics industries. We empower our customers’ technology roadmaps to enable advancements in megatrends such as artificial intelligence, high-performance computing and advanced connectivity. We partner with leading semiconductor and advanced device manufacturers to address complex challenges and develop solutions that facilitate next-generation technological innovations. With over 50 years of experience in systems engineering and material science, a global manufacturing footprint and major application labs across the world, we are well-positioned to capitalize on emerging opportunities across various sectors including data centers, communications infrastructure, industrials, automotive, and consumer electronics.
In its own words, from its 10-K, filed Feb 26, 2026.
Qnity Electronics against its Semiconductors & Related Devices peers
The largest companies of the same SEC industry, each at its latest quarter. Revenue growth: +22% against the peers' median +40%. Operating margin: 15.9% against the peers' median 40.1%.
| Company | Quarter | Revenue | Y/Y | Op. margin |
|---|---|---|---|---|
| Q Qnity Electronics | Q3 2026 | $1.6B | +22% | 15.9% |
| NVDA NVIDIA | Q2 FY27 | $96.2B | +106% | 66.2% |
| MU Micron Technology | Q4 FY26 | $54.2B | +379% | 80.7% |
| AVGO Broadcom | Q3 FY26 | $29.6B | +86% | 53.9% |
| INTC Intel | Q3 2026 | $16.5B | +21% | 15.3% |
| AMD Advanced Micro Devices | Q3 2026 | $13.4B | +45% | 21.2% |
| AMAT Applied Materials | Q3 FY26 | $9.1B | +25% | 33.7% |
| TXN Texas Instruments | Q3 2026 | $6.1B | +28% | 47.5% |
| ADI Analog Devices | Q3 FY26 | $4.0B | +40% | 40.1% |
Source: Qnity Electronics 10-Q on SEC EDGAR · CIK 2058873 · Semiconductors & Related Devices
Guidance and outlook
13F: who owns Q and who is buying
More on Q
History
Every quarter: Q3 2026 results · Q2 2026 results · Q1 2026 results · Q4 2025 results · Q3 2025 results
- Qnity Electronics guidance history: guided vs reported
- Qnity Electronics operating margin by quarter
- Qnity Electronics net income by quarter
- Qnity Electronics free cash flow by quarter
- Qnity Electronics R&D spending by quarter
- Qnity Electronics capital expenditures by quarter
- Qnity Electronics Semiconductor Technologies revenue by quarter
- Qnity Electronics Interconnect Solutions revenue by quarter