Filing Flows › Consumer Discretionary › Restaurant Brands International Limited Partnership (QSP)
Restaurant Brands International Limited Partnership (QSP) earnings and revenue breakdown
Latest: Q3 2026 · 10-Q filed Oct 29, 2026 · Restaurant Brands International Limited Partnership (QSP) Q3 2026 earnings results →
Q3 2026 Revenue up 3% year over year to $2.5B · 28¢ of every $1 of revenue kept as net profit · operating margin 27.6%
Restaurant Brands International Limited Partnership made $2.5B in Q3 2026 (+3% Y/Y): TH $1.1B, RH $487M, BK $345M. Operating margin 27.6%, net earnings $704M. See where every dollar goes — costs, profit and cash — as a Sankey from the 10-Q filed Oct 29, 2026.
Drawing the Sankey…
Open the interactive Sankey → click any line for what the company wrote about it, compare Y/Y and Q/Q, export as PNG or PDF
What changed this quarter
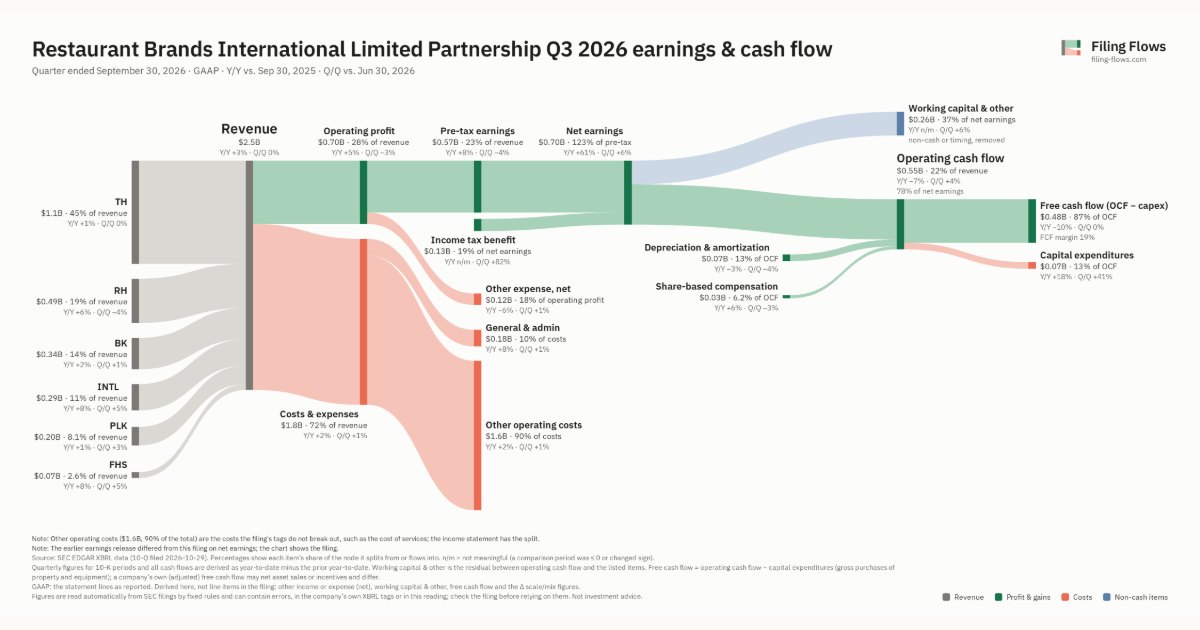
Revenue was $2.5B in Q3 2026, up 3% year over year and roughly flat from the previous quarter. TH was the largest line at 45% of revenue. RH added $0.03B year over year (up 6%), 37% of the total change.
Operating profit was $0.70B, a 27.6% margin (up 0.5 points year over year). Of the extra revenue versus Q3 2025, 43% reached operating profit, above the 27% margin then. Total costs grew 2% against revenue growth of 3%. Net earnings were $0.70B, up 61% year over year. The effective tax rate was -23.3%.
Operating cash flow was $0.55B (down 7% year over year), 78% of net earnings. Non-cash charges added back $0.07B of depreciation and amortization and $0.03B of share-based compensation. Working capital and other items used $0.26B. Capital expenditures of $0.07B left free cash flow of $0.48B.
Quarterly history
| Quarter | Form | Filed | Revenue | Y/Y | Op. margin | Net earnings | Op. cash flow |
|---|---|---|---|---|---|---|---|
| Q3 2026 | 10-Q | Oct 29, 2026 | $2.5B | +3% | 27.6% | $704M | $551M |
| Q2 2026 | 10-Q | Aug 6, 2026 | $2.5B | +5% | 28.4% | $665M | $530M |
| Q1 2026 | 10-Q | May 6, 2026 | $2.3B | +7% | 26.8% | $445M | $227M |
| Q4 2025 | 10-K | Feb 20, 2026 | $2.5B | +7% | 25.2% | $155M | $555M |
| Q3 2025 | 10-Q | Oct 30, 2025 | $2.4B | +7% | 27.1% | $436M | $592M |
| Q2 2025 | 10-Q | Aug 7, 2025 | $2.4B | +16% | 20.0% | $263M | $449M |
| Q1 2025 | 10-Q | May 8, 2025 | $2.1B | +21% | 20.6% | $221M | $118M |
Charts
Interactive views
The same charts as the app — open one to draw it.
💵Where each $1 goesinteractive
Loading the interactive chart…
🌏Named in Asian annual reportsinteractive
Loading the interactive chart…
🔄Rotation against the market and its industry (RRG)interactive
Loading the interactive chart…
🔍Earnings qualityinteractive
Loading the interactive chart…
⚖️Fair value by methodinteractive
Loading the interactive chart…
🔭Outlook & guidanceinteractive
Loading the interactive chart…
📈Investments: gains and what it boughtinteractive
Loading the interactive chart…
🏭Its industry’s money flow (input-output)interactive
Loading the interactive chart…
About Restaurant Brands International Limited Partnership
We are one of the world’s largest quick service restaurant (“QSR”) companies with nearly $47 billion in annual system-wide sales and over 33,000 restaurants in more than 120 countries and territories as of December 31, 2025. As of the date of this Annual Report on Form 10-K, over 95% of system-wide restaurants were franchised restaurants. Our remaining restaurants are Company restaurants, primarily restaurants we acquired as a part of the Carrols Acquisition, the vast majority of which we plan to refranchise over the coming years. We also operate some other Company restaurants as test locations for new initiatives and to develop operational talent.
In its own words, from its 10-K, filed Feb 20, 2026.
Restaurant Brands International Limited Partnership against its Retail-Eating Places peers
The largest companies of the same SEC industry, each at its latest quarter. Revenue growth: +3% against the peers' median +5%. Operating margin: 27.6% against the peers' median 13.7%.
| Company | Quarter | Revenue | Y/Y | Op. margin |
|---|---|---|---|---|
| QSP Restaurant Brands International Limited Partnership | Q3 2026 | $2.5B | +3% | 27.6% |
| MCD McDonald's | Q3 2026 | $7.2B | +1% | 50.2% |
| ARMK Aramark | Q3 FY26 | $5.1B | +9% | 4.3% |
| YUMC Yum China Holdings | Q3 2026 | $3.5B | +8% | 13.0% |
| CMG Chipotle Mexican Grill | Q3 2026 | $3.3B | +10% | 13.7% |
| DRI Darden Restaurants | Q1 FY27 | $3.2B | +5% | 10.0% |
| QSR Restaurant Brands International | Q3 2026 | $2.5B | +3% | 27.6% |
| YUM Yum Brands | Q3 2026 | $2.1B | +4% | 112.8% |
| TXRH Texas Roadhouse | Q3 2026 | $1.6B | +10% | 6.5% |
Source: Restaurant Brands International Limited Partnership 10-Q on SEC EDGAR · CIK 1618755 · Retail-Eating Places
More on QSP
History
Every quarter: Q3 2026 results · Q2 2026 results · Q1 2026 results · Q4 2025 results · Q3 2025 results · Q2 2025 results · Q1 2025 results
- Restaurant Brands International Limited Partnership guidance history: guided vs reported
- Restaurant Brands International Limited Partnership operating margin by quarter
- Restaurant Brands International Limited Partnership net income by quarter
- Restaurant Brands International Limited Partnership free cash flow by quarter
- Restaurant Brands International Limited Partnership capital expenditures by quarter
- Restaurant Brands International Limited Partnership TH revenue by quarter
- Restaurant Brands International Limited Partnership RH revenue by quarter
- Restaurant Brands International Limited Partnership BK revenue by quarter
Compare QSP with
- Restaurant Brands International Limited Partnership vs Restaurant Brands International (QSP vs QSR)
- Restaurant Brands International Limited Partnership vs Restaurant Brands International (QSP vs QSR)
- Restaurant Brands International Limited Partnership vs Yum Brands (QSP vs YUM)
- Restaurant Brands International Limited Partnership vs Darden Restaurants (QSP vs DRI)
中文版:Restaurant Brands International Limited Partnership(QSP)财报