Filing Flows › Consumer Discretionary › Yum China Holdings (YUMC)
Yum China Holdings (YUMC) earnings and revenue breakdown
Latest: Q3 2026 · 10-Q filed Nov 5, 2026 · Yum China Holdings (YUMC) Q3 2026 earnings results →
Q3 2026 Revenue up 8% year over year to $3.5B · 9¢ of every $1 of revenue kept as net profit · operating margin 13.0%
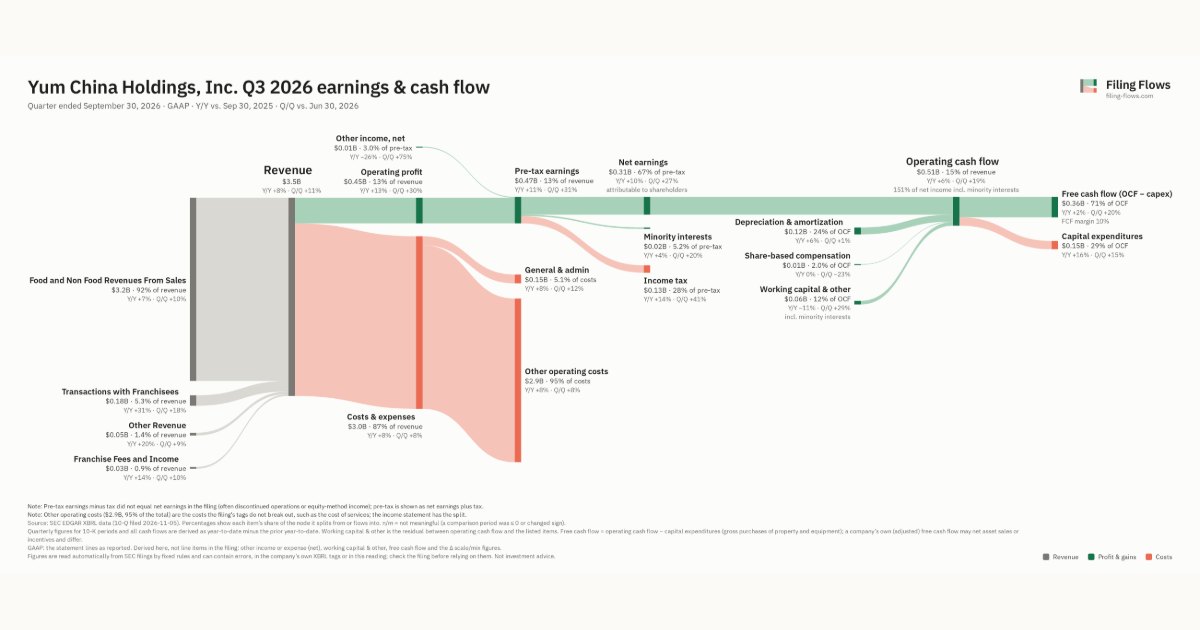
Yum China Holdings made $3.5B in Q3 2026 (+8% Y/Y): Food and Non Food Revenues From Sales $3.2B, Transactions with Franchisees $183M, Other Revenue $48.0M. Operating margin 13.0%, net earnings $311M. See where every dollar goes — costs, profit and cash — as a Sankey from the 10-Q filed Nov 5, 2026.
Drawing the Sankey…
Open the interactive Sankey → click any line for what the company wrote about it, compare Y/Y and Q/Q, export as PNG or PDF
What changed this quarter
Revenue was $3.5B in Q3 2026, up 8% year over year and up 11% from the previous quarter. Food and Non Food Revenues From Sales was the largest line at 92% of revenue. Food and Non Food Revenues From Sales added $0.22B year over year (up 7%), 80% of the total change.
Operating profit was $0.45B, a 13.0% margin (up 0.5 points year over year). Of the extra revenue versus Q3 2025, 19% reached operating profit, above the 12% margin then. Total costs grew 8% against revenue growth of 8%. Net earnings were $0.31B, up 10% year over year. The effective tax rate was 28.0%.
Operating cash flow was $0.51B (up 6% year over year), 151% of net income including minority interests. Non-cash charges added back $0.12B of depreciation and amortization and $0.01B of share-based compensation. Working capital and other items added $0.04B. Capital expenditures of $0.15B left free cash flow of $0.36B.
Quarterly history
| Quarter | Form | Filed | Revenue | Y/Y | Op. margin | Net earnings | Op. cash flow |
|---|---|---|---|---|---|---|---|
| Q3 2026 | 10-Q | Nov 5, 2026 | $3.5B | +8% | 13.0% | $311M | $505M |
| Q2 2026 | 10-Q | Aug 10, 2026 | $3.1B | +13% | 11.1% | $244M | $426M |
| Q1 2026 | 10-Q | May 8, 2026 | $3.3B | +10% | 13.7% | $309M | $550M |
| Q4 2025 | 10-K | Feb 27, 2026 | $2.8B | +9% | 6.6% | $140M | $125M |
| Q3 2025 | 10-Q | Nov 10, 2025 | $3.2B | +4% | 12.5% | $282M | $477M |
| Q2 2025 | 10-Q | Aug 11, 2025 | $2.8B | +4% | 10.9% | $215M | $412M |
| Q1 2025 | 10-Q | May 9, 2025 | $3.0B | +0.8% | 13.4% | $292M | $452M |
Charts
Interactive views
The same charts as the app — open one to draw it.
💵Where each $1 goesinteractive
Loading the interactive chart…
🌏Named in Asian annual reportsinteractive
Loading the interactive chart…
🔄Rotation against the market and its industry (RRG)interactive
Loading the interactive chart…
🔍Earnings qualityinteractive
Loading the interactive chart…
⚖️Fair value by methodinteractive
Loading the interactive chart…
🔭Outlook & guidanceinteractive
Loading the interactive chart…
📈Investments: gains and what it boughtinteractive
Loading the interactive chart…
🏭Its industry’s money flow (input-output)interactive
Loading the interactive chart…
About Yum China Holdings
Yum China is the largest restaurant company in China with a mission to make every life taste beautiful. The Company operates over 19,000 restaurants under six brands across over 2,700 cities in China. KFC and Pizza Hut are the leading brands in the quick-service and casual dining restaurant spaces in China, respectively. In addition, Yum China has partnered with Lavazza to develop the Lavazza coffee concept in China. Little Sheep and Huang Ji Huang specialize in Chinese cuisine. Taco Bell offers innovative Mexican-inspired food. Yum China has a world-class, digitalized supply chain, which includes an extensive network of logistics centers nationwide and an in-house supply chain management system. Its strong digital capabilities and loyalty program enable the Company to reach customers faster and serve them better.
In its own words, from its 8-K, filed Jul 30, 2026.
Yum China Holdings against its Retail-Eating Places peers
The largest companies of the same SEC industry, each at its latest quarter. Revenue growth: +8% against the peers' median +8%. Operating margin: 13.0% against the peers' median 13.0%.
| Company | Quarter | Revenue | Y/Y | Op. margin |
|---|---|---|---|---|
| YUMC Yum China Holdings | Q3 2026 | $3.5B | +8% | 13.0% |
| MCD McDonald's | Q3 2026 | $7.2B | +1% | 50.2% |
| ARMK Aramark | Q3 FY26 | $5.1B | +9% | 4.3% |
| CMG Chipotle Mexican Grill | Q3 2026 | $3.3B | +10% | 13.7% |
| DRI Darden Restaurants | Q1 FY27 | $3.2B | +5% | 10.0% |
| QSR Restaurant Brands International | Q3 2026 | $2.5B | +3% | 27.6% |
| YUM Yum Brands | Q3 2026 | $2.1B | +4% | 112.8% |
| TXRH Texas Roadhouse | Q3 2026 | $1.6B | +10% | 6.5% |
| EAT Brinker International | Q1 FY27 | $1.5B | +9% | 10.2% |
Source: Yum China Holdings 10-Q on SEC EDGAR · CIK 1673358 · Retail-Eating Places
Guidance and outlook
13F: who owns YUMC and who is buying
More on YUMC
- How Yum China Holdings makes money: revenue by segment
- Yum China Holdings next earnings date and what analysts expect
- Yum China Holdings stock forecast, price target and fair value
- Who owns Yum China Holdings stock: holders, funds and Congress trades
- Yum China Holdings guidance and outlook
- Is Yum China Holdings a takeover target? LBO and rumors
History
Every quarter: Q3 2026 results · Q2 2026 results · Q1 2026 results · Q4 2025 results · Q3 2025 results · Q2 2025 results · Q1 2025 results
- Yum China Holdings guidance history: guided vs reported
- Yum China Holdings operating margin by quarter
- Yum China Holdings net income by quarter
- Yum China Holdings free cash flow by quarter
- Yum China Holdings capital expenditures by quarter
- Yum China Holdings Food and Non Food Revenues From Sales revenue by quarter
- Yum China Holdings Transactions with Franchisees revenue by quarter
- Yum China Holdings Other Revenue revenue by quarter