Filing Flows › Consumer Discretionary › Darden Restaurants (DRI)
Darden Restaurants (DRI) earnings and revenue breakdown
Latest: Q1 FY27 · 10-Q filed Oct 2, 2026 · Darden Restaurants (DRI) Q1 FY27 earnings results →
Q1 FY27 Revenue up 5% year over year to $3.2B · 7¢ of every $1 of revenue kept as net profit · operating margin 10.0%
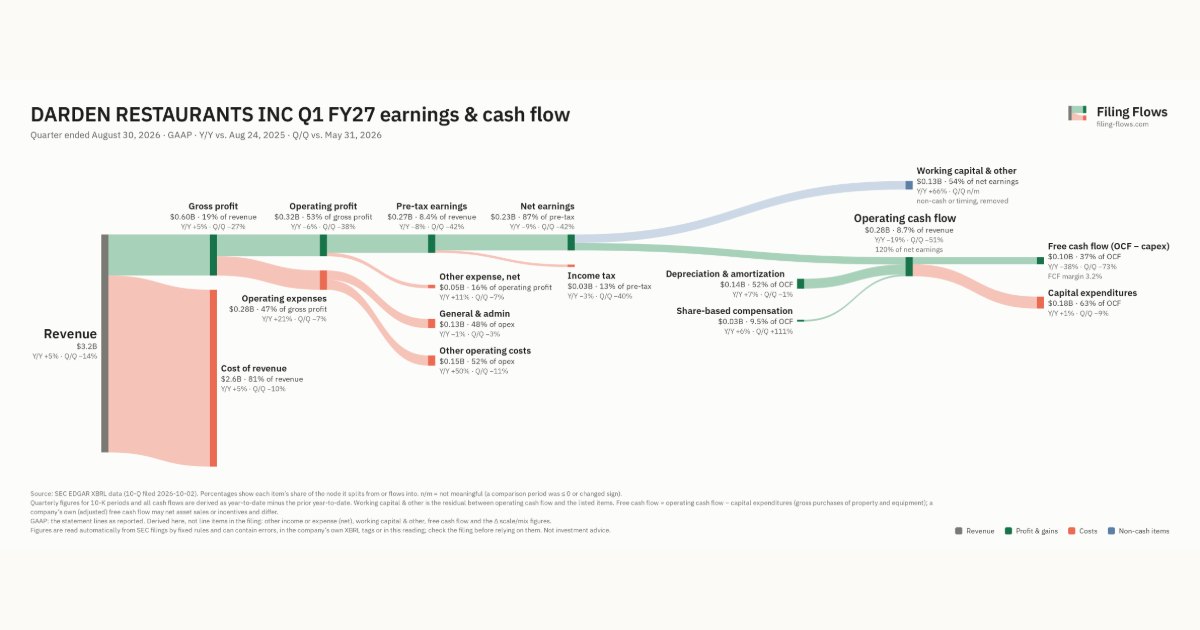
Darden Restaurants made $3.2B in Q1 FY27 (+5% Y/Y). Operating margin 10.0%, net earnings $233M. See where every dollar goes — costs, profit and cash — as a Sankey from the 10-Q filed Oct 2, 2026.
Drawing the Sankey…
Open the interactive Sankey → click any line for what the company wrote about it, compare Y/Y and Q/Q, export as PNG or PDF
What changed this quarter
Revenue was $3.2B in Q1 FY27, up 5% year over year and down 14% from the previous quarter.
Gross margin was 18.8%, unchanged from Q1 FY26. Operating profit was $0.32B, a 10.0% margin (down 1.2 points year over year). Operating profit fell $0.02B even though revenue rose $0.16B versus Q1 FY26, so costs grew faster than sales. Operating expenses grew 21% against revenue growth of 5%. The fastest-growing cost line was Other operating costs (+50%). Net earnings were $0.23B, down 9% year over year. The effective tax rate was 12.9%.
Operating cash flow was $0.28B (down 19% year over year), 120% of net earnings. Non-cash charges added back $0.14B of depreciation and amortization and $0.03B of share-based compensation. Working capital and other items used $0.13B. Capital expenditures of $0.18B left free cash flow of $0.10B.
Quarterly history
| Quarter | Form | Filed | Revenue | Y/Y | Op. margin | Net earnings | Op. cash flow |
|---|---|---|---|---|---|---|---|
| Q1 FY27 | 10-Q | Oct 2, 2026 | $3.2B | +5% | 10.0% | $233M | $279M |
| Q4 FY26 | 10-K | Jul 24, 2026 | $3.7B | +14% | 13.9% | $405M | $572M |
| Q3 FY26 | 10-Q | Mar 27, 2026 | $3.3B | +6% | 12.1% | $307M | $618M |
| Q2 FY26 | 10-Q | Dec 30, 2025 | $3.1B | +7% | 10.3% | $237M | $321M |
| Q1 FY26 | 10-Q | Sep 26, 2025 | $3.0B | +10% | 11.1% | $258M | $342M |
| Q4 FY25 | 10-K | Jul 18, 2025 | $3.3B | +11% | 11.7% | $304M | $457M |
| Q3 FY25 | 10-Q | Apr 1, 2025 | $3.2B | +6% | 13.2% | $323M | $588M |
Charts
Interactive views
The same charts as the app — open one to draw it.
💵Where each $1 goesinteractive
Loading the interactive chart…
🌏Named in Asian annual reportsinteractive
Loading the interactive chart…
🔄Rotation against the market and its industry (RRG)interactive
Loading the interactive chart…
🔍Earnings qualityinteractive
Loading the interactive chart…
⚖️Fair value by methodinteractive
Loading the interactive chart…
🔭Outlook & guidanceinteractive
Loading the interactive chart…
📈Investments: gains and what it boughtinteractive
Loading the interactive chart…
🏭Its industry’s money flow (input-output)interactive
Loading the interactive chart…
About Darden Restaurants
Darden Restaurants, Inc. (“Darden,” the “Company,” “we,” “us,” or “our”) is a full-service restaurant company, and as of May 31, 2026, we owned and operated 2,202 restaurants through subsidiaries in the United States under the Olive Garden ® , LongHorn Steakhouse ® , Yard House ® , Ruth’s Chris Steak House ® (“Ruth’s Chris”), Cheddar’s Scratch Kitchen ® , The Capital Grille ® , Chuy’s ® , Seasons 52 ® , Eddie V’s Prime Seafood ® (“Eddie V’s”), Bahama Breeze ® , and The Capital Burger ® trademarks. As of May 31, 2026, we also had 167 restaurants operated by independent third parties pursuant to area development and franchise agreements, four restaurants operating under contractual agreements, and one restaurant that we jointly own with a third party and operate independently.
In its own words, from its 10-K, filed Jul 24, 2026.
Darden Restaurants against its Retail-Eating Places peers
The largest companies of the same SEC industry, each at its latest quarter. Revenue growth: +5% against the peers' median +8%. Operating margin: 10.0% against the peers' median 13.0%.
| Company | Quarter | Revenue | Y/Y | Op. margin |
|---|---|---|---|---|
| DRI Darden Restaurants | Q1 FY27 | $3.2B | +5% | 10.0% |
| MCD McDonald's | Q3 2026 | $7.2B | +1% | 50.2% |
| ARMK Aramark | Q3 FY26 | $5.1B | +9% | 4.3% |
| YUMC Yum China Holdings | Q3 2026 | $3.5B | +8% | 13.0% |
| CMG Chipotle Mexican Grill | Q3 2026 | $3.3B | +10% | 13.7% |
| QSR Restaurant Brands International | Q3 2026 | $2.5B | +3% | 27.6% |
| YUM Yum Brands | Q3 2026 | $2.1B | +4% | 112.8% |
| TXRH Texas Roadhouse | Q3 2026 | $1.6B | +10% | 6.5% |
| EAT Brinker International | Q1 FY27 | $1.5B | +9% | 10.2% |
Source: Darden Restaurants 10-Q on SEC EDGAR · CIK 940944 · Retail-Eating Places
Guidance and outlook
13F: who owns DRI and who is buying
More on DRI
History
Every quarter: Q1 FY27 results · Q4 FY26 results · Q3 FY26 results · Q2 FY26 results · Q1 FY26 results · Q4 FY25 results · Q3 FY25 results