Filing Flows › Financials › Rocket Companies (RKT)
Rocket Companies (RKT) earnings and revenue breakdown
Latest: Q3 2026 · 10-Q filed Oct 30, 2026 · Rocket Companies (RKT) Q3 2026 earnings results →
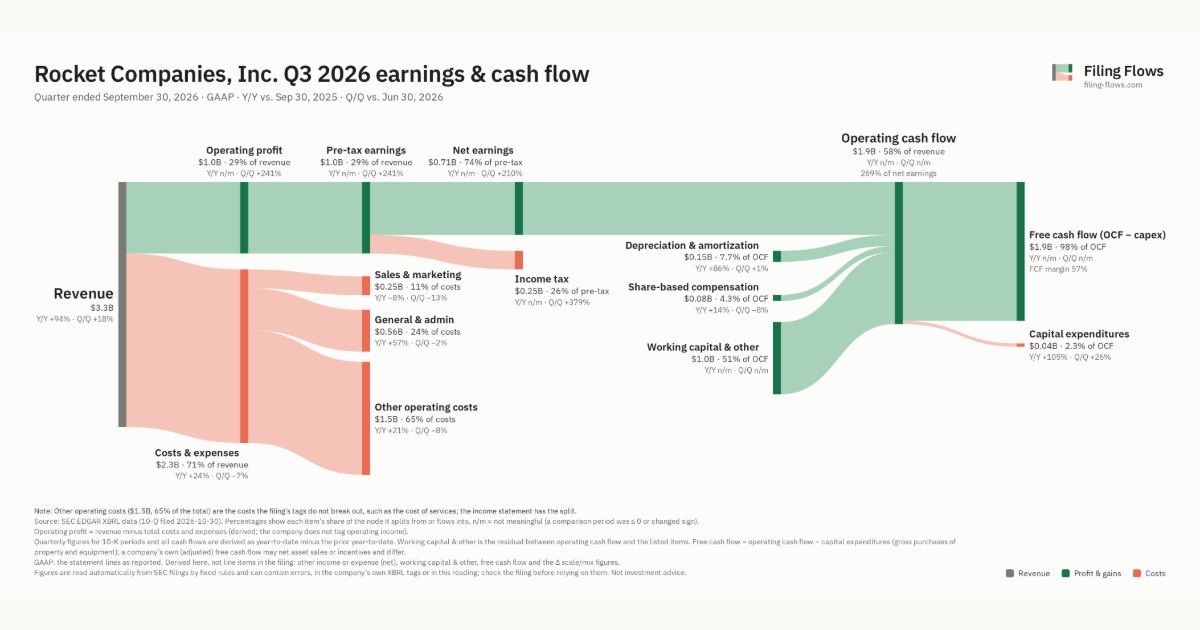
Q3 2026 Revenue up 94% year over year to $3.3B · 22¢ of every $1 of revenue kept as net profit · operating margin 29.2%
Rocket Companies made $3.3B in Q3 2026 (+94% Y/Y). Operating margin 29.2%, net earnings $709M. See where every dollar goes — costs, profit and cash — as a Sankey from the 10-Q filed Oct 30, 2026.
Drawing the Sankey…
Open the interactive Sankey → click any line for what the company wrote about it, compare Y/Y and Q/Q, export as PNG or PDF
What changed this quarter
Revenue was $3.3B in Q3 2026, up 94% year over year and up 18% from the previous quarter.
Operating profit was $1.0B, a 29.2% margin (up 40.1 points year over year). Total costs grew 24% against revenue growth of 94%. The fastest-growing cost line was General & admin (+57%). Net earnings were $0.71B. The effective tax rate was 26.0%.
Operating cash flow was $1.9B, 269% of net earnings. Non-cash charges added back $0.15B of depreciation and amortization and $0.08B of share-based compensation. Working capital and other items added $1.0B. Capital expenditures of $0.04B left free cash flow of $1.9B.
Quarterly history
| Quarter | Form | Filed | Revenue | Y/Y | Op. margin | Net earnings | Op. cash flow |
|---|---|---|---|---|---|---|---|
| Q3 2026 | 10-Q | Oct 30, 2026 | $3.3B | +94% | 29.2% | $709M | $1.9B |
| Q2 2026 | 10-Q | Aug 7, 2026 | $2.8B | +92% | 10.1% | $230M | −$1.2B |
| Q1 2026 | 10-Q | May 12, 2026 | $2.9B | +167% | 13.6% | $297M | $1.9B |
| Q4 2025 | 10-K | Mar 2, 2026 | $2.7B | +52% | 6.3% | $68.0M | −$1.2B |
| Q3 2025 | 10-Q | Nov 6, 2025 | $1.6B | +148% | -17.1% | −$124M | −$49.0M |
| Q2 2025 | 10-Q | Aug 8, 2025 | $1.4B | +5% | 1.8% | $34.0M | −$1.9B |
| Q1 2025 | 10-Q | May 9, 2025 | $1.0B | -25% | -27.6% | −$212M | −$796M |
Charts
Interactive views
The same charts as the app — open one to draw it.
💵Where each $1 goesinteractive
Loading the interactive chart…
🌏Named in Asian annual reportsinteractive
Loading the interactive chart…
🔄Rotation against the market and its industry (RRG)interactive
Loading the interactive chart…
🔍Earnings qualityinteractive
Loading the interactive chart…
⚖️Fair value by methodinteractive
Loading the interactive chart…
🔭Outlook & guidanceinteractive
Loading the interactive chart…
📈Investments: gains and what it boughtinteractive
Loading the interactive chart…
🏭Its industry’s money flow (input-output)interactive
Loading the interactive chart…
About Rocket Companies
We are a Detroit‑based fintech company including mortgage, real estate and personal finance businesses with a mission to Help Everyone Home. We are committed to delivering industry-best client experiences through our AI-powered, vertically integrated homeownership ecosystem. Our full suite of products empowers our clients across home search, mortgage finance and servicing, title and closing, financial wellness and personal loans. We believe our widely recognized “Rocket” brand is synonymous with simple, fast and trusted digital experiences.
In its own words, from its 10-K, filed Mar 2, 2026.
Rocket Companies against its Mortgage Bankers & Loan Correspondents peers
The largest companies of the same SEC industry, each at its latest quarter. Revenue growth: +94% against the peers' median -4%. Operating margin: 29.2% against the peers' median 9.4%.
| Company | Quarter | Revenue | Y/Y | Op. margin |
|---|---|---|---|---|
| RKT Rocket Companies | Q3 2026 | $3.3B | +94% | 29.2% |
| UWMC UWM Holdings | Q3 2026 | $811M | -4% | 27.6% |
| PFSI PennyMac Financial Services | Q3 2026 | $469M | -26% | 9.1% |
| ONIT Onity Group | Q3 2026 | $278M | -0.8% | 57.6% |
| FOA Finance of America Companies | Q2 2026 | $62.5M | -65% | -113.7% |
| Korth Direct Mortgage | Q2 2026 | $3.3M | -21% | 9.4% |
| BLNE Beeline Holdings | Q2 2026 | $2.6M | +57% | -171.0% |
Source: Rocket Companies 10-Q on SEC EDGAR · CIK 1805284 · Mortgage Bankers & Loan Correspondents
Guidance and outlook
13F: who owns RKT and who is buying
More on RKT
- How Rocket Companies makes money: revenue by segment
- Rocket Companies next earnings date and what analysts expect
- Rocket Companies stock forecast, price target and fair value
- Who owns Rocket Companies stock: holders, funds and Congress trades
- Rocket Companies guidance and outlook
- Rocket Companies recalls, complaints and regulation
History
Every quarter: Q3 2026 results · Q2 2026 results · Q1 2026 results · Q4 2025 results · Q3 2025 results · Q2 2025 results · Q1 2025 results