Filing Flows › Industrials › Regal Rexnord (RRX)
Regal Rexnord (RRX) earnings and revenue breakdown
Latest: Q3 2026 · 10-Q filed Nov 3, 2026 · Regal Rexnord (RRX) Q3 2026 earnings results →
Q3 2026 Revenue up 6% year over year to $1.6B · 1¢ of every $1 of revenue lost · operating margin 5.1%
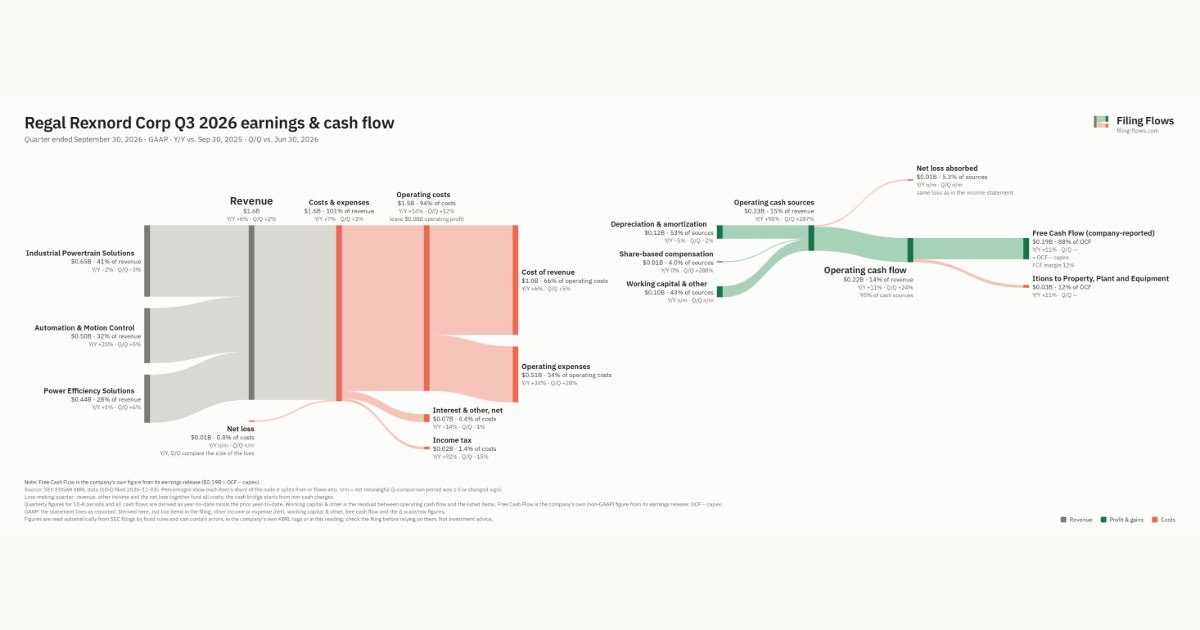
Regal Rexnord made $1.6B in Q3 2026 (+6% Y/Y): Industrial Powertrain Solutions $650M, Automation & Motion Control $501M, Power Efficiency Solutions $438M. Operating margin 5.1%, net loss $12.3M. See where every dollar goes — costs, profit and cash — as a Sankey from the 10-Q filed Nov 3, 2026.
Drawing the Sankey…
Open the interactive Sankey → click any line for what the company wrote about it, compare Y/Y and Q/Q, export as PNG or PDF
What changed this quarter
Revenue was $1.6B in Q3 2026, up 6% year over year and up 2% from the previous quarter. Industrial Powertrain Solutions was the largest line at 41% of revenue. Automation & Motion Control added $0.10B year over year (up 25%), 108% of the total change. Industrial Powertrain Solutions declined 2%.
Gross margin was 37.2%, up 0.1 points from Q3 2025. Operating profit was $0.08B, a 5.1% margin (down 6.5 points year over year). Operating profit fell $0.09B even though revenue rose $0.09B versus Q3 2025, so costs grew faster than sales. Operating expenses grew 34% against revenue growth of 6%. The quarter ended with a net loss of $0.01B, after a profit of $0.12B the previous quarter. Net interest and other expense of $0.07B was the main reason.
Operating cash flow was $0.22B (up 11% year over year). Non-cash charges added back $0.12B of depreciation and amortization and $0.01B of share-based compensation. Working capital and other items added $0.10B. After itions to Property, Plant and Equipment ($0.03B), free cash flow as the company reports it was $0.19B.
Quarterly history
| Quarter | Form | Filed | Revenue | Y/Y | Op. margin | Net earnings | Op. cash flow |
|---|---|---|---|---|---|---|---|
| Q3 2026 | 10-Q | Nov 3, 2026 | $1.6B | +6% | 5.1% | −$12.3M | $220M |
| Q2 2026 | 10-Q | Aug 5, 2026 | $1.6B | +4% | 13.8% | $117M | $177M |
| Q1 2026 | 10-Q | May 7, 2026 | $1.5B | +4% | 10.3% | $64.3M | $14.9M |
| Q4 2025 | 10-K | Feb 20, 2026 | $1.5B | +4% | 10.8% | $63.8M | $168M |
| Q3 2025 | 10-Q | Oct 30, 2025 | $1.5B | +1% | 11.6% | $80.0M | $198M |
| Q2 2025 | 10-Q | Aug 6, 2025 | $1.5B | -3% | 12.2% | $79.6M | $523M |
| Q1 2025 | 10-Q | May 6, 2025 | $1.4B | -8% | 11.3% | $57.5M | $102M |
Charts
Interactive views
The same charts as the app — open one to draw it.
💵Where each $1 goesinteractive
Loading the interactive chart…
🌏Named in Asian annual reportsinteractive
Loading the interactive chart…
🔄Rotation against the market and its industry (RRG)interactive
Loading the interactive chart…
🔍Earnings qualityinteractive
Loading the interactive chart…
⚖️Fair value by methodinteractive
Loading the interactive chart…
🔭Outlook & guidanceinteractive
Loading the interactive chart…
📈Investments: gains and what it boughtinteractive
Loading the interactive chart…
🏭Its industry’s money flow (input-output)interactive
Loading the interactive chart…
About Regal Rexnord
Regal Rexnord Corporation (NYSE: RRX) (“we,” “us,” “our” or the “Company”) and its associates around the world help create a better tomorrow by providing sustainable solutions that power, transmit and control motion. The Company’s electric motors and air moving subsystems provide the power to create motion. A portfolio of highly engineered power transmission components and subsystems efficiently transmits motion to power industrial applications. The Company's automation offering, comprised of controllers, drives, precision motors, and actuators, controls motion in applications ranging from factory automation to precision tools used in surgical applications. The Company is headquartered in Milwaukee, Wisconsin and has manufacturing, sales and service facilities worldwide.
In its own words, from its 10-K, filed Feb 20, 2026.
Regal Rexnord against its General Industrial Machinery & Equipment, NEC peers
The largest companies of the same SEC industry, each at its latest quarter. Revenue growth: +6% against the peers' median +17%. Operating margin: 5.1% against the peers' median 0.5%.
| Company | Quarter | Revenue | Y/Y | Op. margin |
|---|---|---|---|---|
| RRX Regal Rexnord | Q3 2026 | $1.6B | +6% | 5.1% |
| ESAB Esab | Q3 2026 | $825M | +13% | 11.1% |
| NDSN Nordson | Q3 FY26 | $818M | +10% | 27.3% |
| SYM Symbotic | Q3 FY26 | $721M | +22% | 4.6% |
| OUST Ouster | Q3 2026 | $59.3M | +50% | -32.5% |
| CHRN ChronoScale Holdings | Q3 2026 | $41.5M | +148% | -60.0% |
| TAYD Taylor Devices | Q1 FY27 | $7.3M | -26% | 0.5% |
| SERV Serve Robotics | Q3 2026 | $2.8M | +313% | n/m |
| RR Richtech Robotics | Q3 FY26 | $1.4M | +17% | -966.3% |
Source: Regal Rexnord 10-Q on SEC EDGAR · CIK 82811 · General Industrial Machinery & Equipment, NEC
Guidance and outlook
13F: who owns RRX and who is buying
More on RRX
- How Regal Rexnord makes money: revenue by segment
- Regal Rexnord next earnings date and what analysts expect
- Regal Rexnord stock forecast, price target and fair value
- Who owns Regal Rexnord stock: holders, funds and Congress trades
- Regal Rexnord guidance and outlook
- Is Regal Rexnord a takeover target? LBO and rumors
History
Every quarter: Q3 2026 results · Q2 2026 results · Q1 2026 results · Q4 2025 results · Q3 2025 results · Q2 2025 results · Q1 2025 results
- Regal Rexnord guidance history: guided vs reported
- Regal Rexnord gross margin by quarter
- Regal Rexnord operating margin by quarter
- Regal Rexnord net income by quarter
- Regal Rexnord free cash flow by quarter
- Regal Rexnord capital expenditures by quarter
- Regal Rexnord Industrial Powertrain Solutions revenue by quarter
- Regal Rexnord Automation & Motion Control revenue by quarter
- Regal Rexnord Power Efficiency Solutions revenue by quarter