Filing Flows › Industrials › Serve Robotics (SERV)
Serve Robotics (SERV) earnings and revenue breakdown
Latest: Q3 2026 · 10-Q filed Nov 5, 2026 · Serve Robotics (SERV) Q3 2026 earnings results →
Q3 2026 Revenue up 313% year over year to $2.8M
Serve Robotics made $2.8M in Q3 2026 (+313% Y/Y): Fleet services $2.6M, Software services $253K. Operating margin n/m, net loss $59.2M. See where every dollar goes — costs, profit and cash — as a Sankey from the 10-Q filed Nov 5, 2026.
Drawing the Sankey…
Open the interactive Sankey → click any line for what the company wrote about it, compare Y/Y and Q/Q, export as PNG or PDF
What changed this quarter
Revenue was $2.8M in Q3 2026, up 313% year over year and down 12% from the previous quarter. Fleet services was the largest line at 91% of revenue. Fleet services added $2.1M year over year (up 496%), 100% of the total change.
Operating costs exceeded revenue by $61.2M, an operating margin of -2158.3%. Total costs grew 80% against revenue growth of 313%. The fastest-growing cost line was Sales & marketing (+298%). The quarter ended with a net loss of $59.2M, narrower than the previous quarter's $64.1M loss.
Operating cash flow was −$38.8M. Non-cash charges added back $5.4M of depreciation and amortization and $12.5M of share-based compensation. Working capital and other items added $2.5M. Capital expenditures of $5.3M exceeded it, leaving free cash flow of −$44.1M.
Quarterly history
| Quarter | Form | Filed | Revenue | Y/Y | Op. margin | Net earnings | Op. cash flow |
|---|---|---|---|---|---|---|---|
| Q3 2026 | 10-Q | Nov 5, 2026 | $2.8M | +313% | n/m | −$59.2M | −$38.8M |
| Q2 2026 | 10-Q | Aug 6, 2026 | $3.2M | +404% | n/m | −$64.1M | −$43.3M |
| Q1 2026 | 10-Q | May 7, 2026 | $3.0M | +578% | n/m | −$49.0M | −$41.4M |
| Q4 2025 | 10-K | Mar 12, 2026 | $882K | +401% | n/m | −$34.3M | −$29.6M |
| Q3 2025 | 10-Q | Nov 14, 2025 | $687K | +210% | n/m | −$33.0M | −$25.2M |
| Q2 2025 | 10-Q | Aug 8, 2025 | $642K | +37% | n/m | −$20.9M | −$16.0M |
| Q1 2025 | 10-Q | May 8, 2025 | $440K | -54% | n/m | −$13.2M | −$9.5M |
Charts
In supply chains and themes
Interactive views
The same charts as the app — open one to draw it.
💵Where each $1 goesinteractive
Loading the interactive chart…
🌏Named in Asian annual reportsinteractive
Loading the interactive chart…
🔄Rotation against the market and its industry (RRG)interactive
Loading the interactive chart…
🔍Earnings qualityinteractive
Loading the interactive chart…
⚖️Fair value by methodinteractive
Loading the interactive chart…
🔭Outlook & guidanceinteractive
Loading the interactive chart…
📈Investments: gains and what it boughtinteractive
Loading the interactive chart…
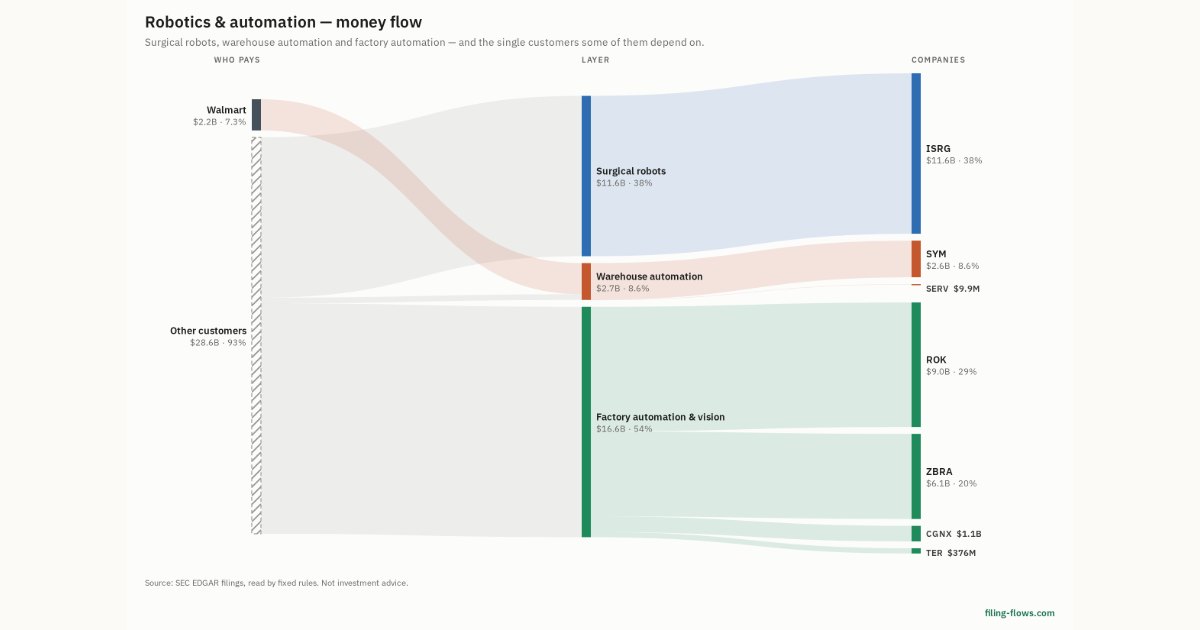
🏭Its industry’s money flow (input-output)interactive
Loading the interactive chart…
Customers and suppliers named in filings
Buys from
- NVDA · Stated in 10-K (named, share not stated) · source
- OUST · Stated in 10-K (named, share not stated) · source
About Serve Robotics
Unless otherwise stated or the context otherwise indicates, all references to “Serve,” the “Company,” “we,” “our,” “us,” or similar terms refer to Serve Robotics Inc. together with its wholly-owned subsidiaries. Serve Operating Co. is our direct, wholly-owned subsidiary and holds all material assets and conducts all business activities and operations of Serve. LiDAR — A digital sensor for measuring distance to objects which uses the principle of radar, but uses light from a laser
In its own words, from its 10-K, filed Mar 12, 2026.
Serve Robotics against its General Industrial Machinery & Equipment, NEC peers
The largest companies of the same SEC industry, each at its latest quarter. Revenue growth: +313% against the peers' median +17%.
| Company | Quarter | Revenue | Y/Y | Op. margin |
|---|---|---|---|---|
| SERV Serve Robotics | Q3 2026 | $2.8M | +313% | n/m |
| RRX Regal Rexnord | Q3 2026 | $1.6B | +6% | 5.1% |
| ESAB Esab | Q3 2026 | $825M | +13% | 11.1% |
| NDSN Nordson | Q3 FY26 | $818M | +10% | 27.3% |
| SYM Symbotic | Q3 FY26 | $721M | +22% | 4.6% |
| OUST Ouster | Q3 2026 | $59.3M | +50% | -32.5% |
| CHRN ChronoScale Holdings | Q3 2026 | $41.5M | +148% | -60.0% |
| TAYD Taylor Devices | Q1 FY27 | $7.3M | -26% | 0.5% |
| RR Richtech Robotics | Q3 FY26 | $1.4M | +17% | -966.3% |
Source: Serve Robotics 10-Q on SEC EDGAR · CIK 1832483 · General Industrial Machinery & Equipment, NEC
Guidance and outlook
13F: who owns SERV and who is buying
More on SERV
History
Every quarter: Q3 2026 results · Q2 2026 results · Q1 2026 results · Q4 2025 results · Q3 2025 results · Q2 2025 results · Q1 2025 results