Filing Flows › Chains › Robotics & automation
Robotics & automation Surgical robots, warehouse automation and factory automation — and the single customers some of them depend on.
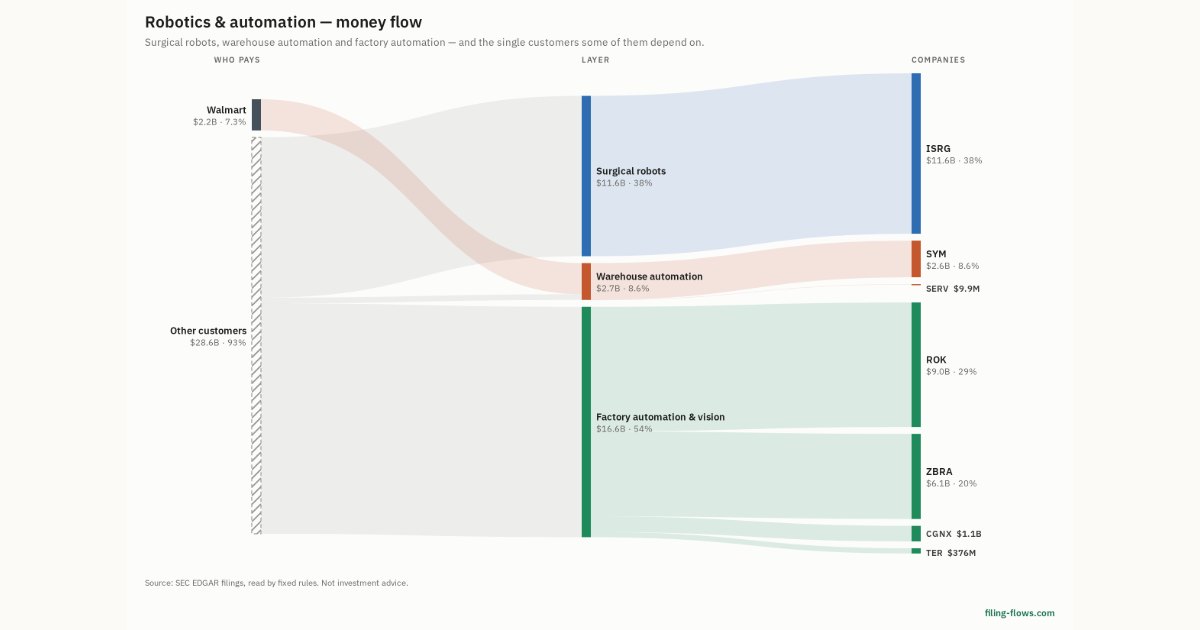
7 companies, $30.9B of revenue in the last twelve months. Trailing twelve months to Oct 4, 2026, from SEC filings.
Open the interactive money-flow chart →
The money-flow chart (open the interactive one above). Robotics & automation: the largest companies by revenue in the chain Robotics & automation: the largest companies by revenue in the chain ISRG · Intuitive Surgical $11.6B ROK · Rockwell Automation $9.0B ZBRA · Zebra $6.1B SYM · Symbotic $2.6B CGNX · Cognex $1.1B TER · Teradyne $376M SERV · Serve Robotics $9.9M The theme quarter by quarter Robotics & automation: the chain's revenue by calendar quarter Robotics & automation: the chain's revenue by calendar quarter $5.6B Q4 2023 $5.9B Q1 2024 $6.1B Q2 2024 $6.2B Q3 2024 $6.4B Q4 2024 $6.4B Q1 2025 $6.8B Q2 2025 $7.1B Q3 2025 $7.4B Q4 2025 $5.8B Q1 2026 $7.8B Q2 2026 $5.0B Q3 2026 Each supplier's quarterly revenue scaled by the share of it this chain takes (its attributed share of the trailing twelve months), summed; 5 companies in the latest quarter, -30% against a year earlier. Companies ISRG Intuitive Surgical $11.6B · total revenue ROK Rockwell Automation $9.0B · total revenue ZBRA Zebra $6.1B · total revenue SYM Symbotic $2.6B · total revenue CGNX Cognex $1.1B · total revenue TER Teradyne $376M · Robotics SERV Serve Robotics $9.9M · total revenue