Filing Flows › Industrials › Cognex (CGNX)
Cognex (CGNX) earnings and revenue breakdown
Latest: Q3 2026 · 10-Q filed Nov 5, 2026 · Cognex (CGNX) Q3 2026 earnings results →
Q3 2026 Revenue up 13% year over year to $313M · 27¢ of every $1 of revenue kept as net profit · operating margin 32.2%
Cognex made $313M in Q3 2026 (+13% Y/Y): Standard products and services (1) $266M, Application-specific customer solutions $47.0M. Operating margin 32.2%, net earnings $84.8M. See where every dollar goes — costs, profit and cash — as a Sankey from the 10-Q filed Nov 5, 2026.
Drawing the Sankey…
Open the interactive Sankey → click any line for what the company wrote about it, compare Y/Y and Q/Q, export as PNG or PDF
What changed this quarter
Revenue was $313.4M in Q3 2026, up 13% year over year and up 8% from the previous quarter. Standard products and services (1) was the largest line at 85% of revenue. Standard products and services (1) added $33.7M year over year (up 15%), 92% of the total change.
Gross margin was 70.8%, up 3.1 points from Q3 2025. Operating profit was $100.8M, a 32.2% margin (up 11.3 points year over year). Of the extra revenue versus Q3 2025, 118% reached operating profit, above the 21% margin then. Operating expenses fell 7% while revenue rose 13%. Net earnings were $84.8M, up 380% year over year. The effective tax rate was 17.9%.
Operating cash flow was $106.4M (up 22% year over year), 125% of net earnings. Non-cash charges added back $6.8M of depreciation and amortization and $11.1M of share-based compensation. Capital expenditures of $2.6M left free cash flow of $103.8M.
Quarterly history
| Quarter | Form | Filed | Revenue | Y/Y | Op. margin | Net earnings | Op. cash flow |
|---|---|---|---|---|---|---|---|
| Q3 2026 | 10-Q | Nov 5, 2026 | $313M | +13% | 32.2% | $84.8M | $106M |
| Q2 2026 | 10-Q | Aug 6, 2026 | $291M | +17% | 29.4% | $72.8M | $69.2M |
| Q1 2026 | 10-Q | May 7, 2026 | $268M | +24% | 22.3% | $51.7M | $45.1M |
| Q4 2025 | 10-K | Feb 12, 2026 | $252M | +10% | 14.0% | $32.7M | $74.9M |
| Q3 2025 | 10-Q | Oct 30, 2025 | $277M | +18% | 20.9% | $17.7M | $87.5M |
| Q2 2025 | 10-Q | Jul 31, 2025 | $249M | +4% | 17.4% | $40.5M | $42.6M |
| Q1 2025 | 10-Q | May 1, 2025 | $216M | +2% | 12.1% | $23.6M | $40.5M |
Charts
In supply chains and themes
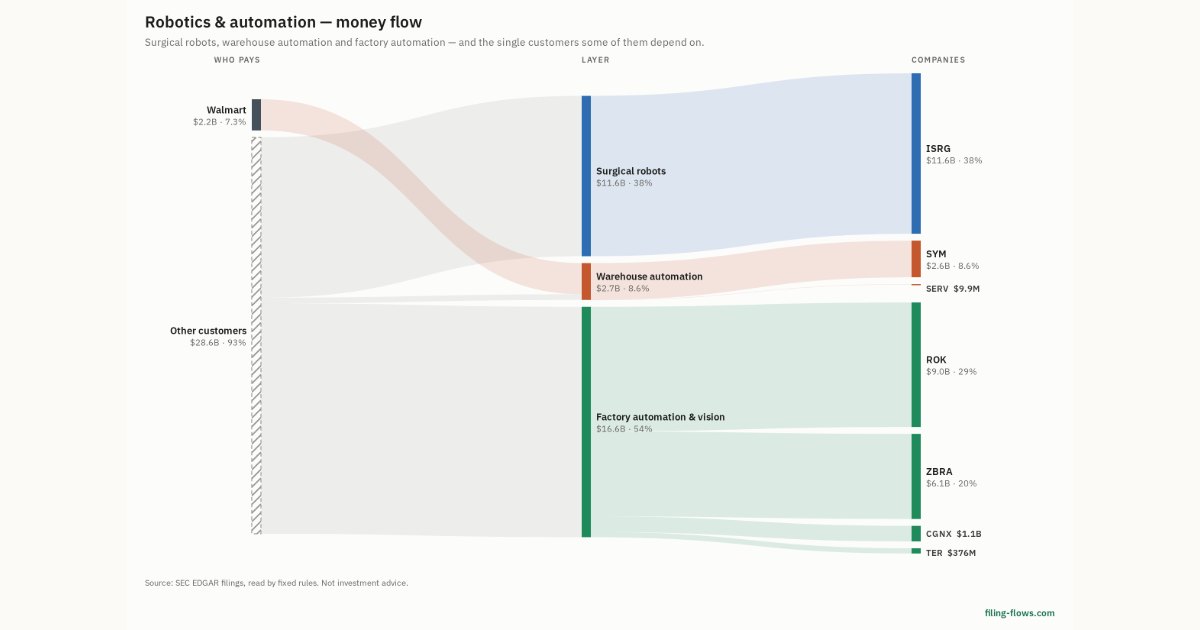
Interactive views
The same charts as the app — open one to draw it.
💵Where each $1 goesinteractive
Loading the interactive chart…
🌏Named in Asian annual reportsinteractive
Loading the interactive chart…
🔄Rotation against the market and its industry (RRG)interactive
Loading the interactive chart…
🔍Earnings qualityinteractive
Loading the interactive chart…
⚖️Fair value by methodinteractive
Loading the interactive chart…
🔭Outlook & guidanceinteractive
Loading the interactive chart…
📈Investments: gains and what it boughtinteractive
Loading the interactive chart…
🏭Its industry’s money flow (input-output)interactive
Loading the interactive chart…
About Cognex
Founded in 1981, Cognex Corporation (the "Company” or “Cognex”) makes advanced machine vision easy, paving the way for manufacturing and distribution companies to become faster, smarter, and more efficient through automation. We are a global technology leader in industrial machine vision systems that seek to improve efficiency and help solve critical manufacturing and distribution challenges, providing support across a diverse set of industrial end markets. Our solutions blend hardware and software to capture and analyze visual information, aiding the automation of manufacturing and distribution tasks for customers worldwide. Machine vision products are used to automate the manufacturing and distribution of discrete items, such as mobile phones, automotive components, and consumer goods, by locating, identifying, inspecting, and measuring them.
In its own words, from its 10-K, filed Feb 12, 2026.
Cognex against its Industrial Instruments For Measurement, Display, and Control peers
The largest companies of the same SEC industry, each at its latest quarter. Revenue growth: +13% against the peers' median +13%. Operating margin: 32.2% against the peers' median 23.1%.
| Company | Quarter | Revenue | Y/Y | Op. margin |
|---|---|---|---|---|
| CGNX Cognex | Q3 2026 | $313M | +13% | 32.2% |
| DHR Danaher | Q3 2026 | $6.6B | +8% | 19.0% |
| AME Ametek | Q3 2026 | $2.2B | +17% | 26.3% |
| ROP Roper Technologies | Q3 2026 | $2.2B | +8% | 28.7% |
| KEYS Keysight Technologies | Q3 FY26 | $1.8B | +36% | 25.0% |
| MKSI MKS | Q3 2026 | $1.4B | +43% | 23.1% |
| FTV Fortive | Q3 2026 | $1.1B | +8% | 21.3% |
| ST Sensata Technologies Holding | Q3 2026 | $1.0B | +8% | 17.5% |
| RAL Ralliant | Q3 2026 | $620M | +17% | 18.9% |
Source: Cognex 10-Q on SEC EDGAR · CIK 851205 · Industrial Instruments For Measurement, Display, and Control
Guidance and outlook
13F: who owns CGNX and who is buying
More on CGNX
History
Every quarter: Q3 2026 results · Q2 2026 results · Q1 2026 results · Q4 2025 results · Q3 2025 results · Q2 2025 results · Q1 2025 results
- Cognex guidance history: guided vs reported
- Cognex gross margin by quarter
- Cognex operating margin by quarter
- Cognex net income by quarter
- Cognex free cash flow by quarter
- Cognex R&D spending by quarter
- Cognex capital expenditures by quarter
- Cognex Standard products and services (1) revenue by quarter
- Cognex Application-specific customer solutions revenue by quarter