Filing Flows › Industrials › MKS (MKSI)
MKS (MKSI) earnings and revenue breakdown
Latest: Q3 2026 · 10-Q filed Nov 5, 2026 · MKS (MKSI) Q3 2026 earnings results →
Q3 2026 Revenue up 43% year over year to $1.4B · 17¢ of every $1 of revenue kept as net profit · operating margin 23.1%
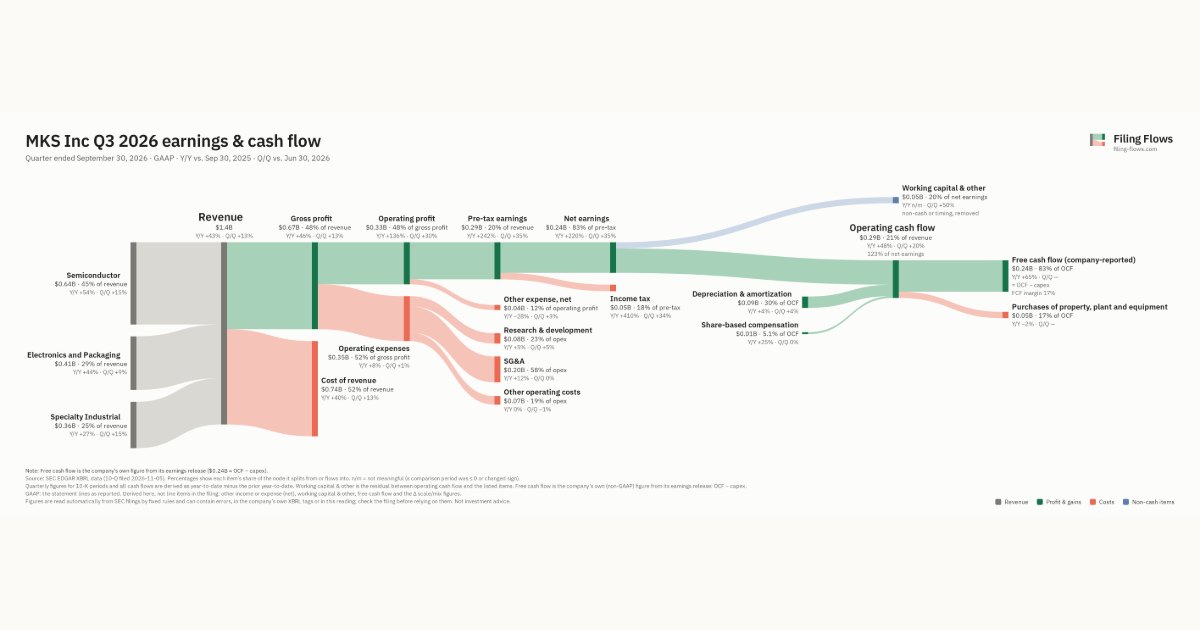
MKS made $1.4B in Q3 2026 (+43% Y/Y): Semiconductor $638M, Electronics and Packaging $415M, Specialty Industrial $360M. Operating margin 23.1%, net earnings $237M. See where every dollar goes — costs, profit and cash — as a Sankey from the 10-Q filed Nov 5, 2026.
Drawing the Sankey…
Open the interactive Sankey → click any line for what the company wrote about it, compare Y/Y and Q/Q, export as PNG or PDF
What changed this quarter
Revenue was $1.4B in Q3 2026, up 43% year over year and up 13% from the previous quarter. Semiconductor was the largest line at 45% of revenue. Semiconductor added $0.22B year over year (up 54%), 52% of the total change.
Gross margin was 47.7%, up 1.0 points from Q3 2025. Operating profit was $0.33B, a 23.1% margin (up 9.1 points year over year). Of the extra revenue versus Q3 2025, 44% reached operating profit, above the 14% margin then. Operating expenses grew 8% against revenue growth of 43%. The fastest-growing cost line was SG&A (+12%). Net earnings were $0.24B, up 219% year over year. The effective tax rate was 17.7%.
Operating cash flow was $0.29B (up 48% year over year), 123% of net earnings. Non-cash charges added back $0.09B of depreciation and amortization and $0.01B of share-based compensation. Working capital and other items used $0.05B. After purchases of property, plant and equipment ($0.05B), free cash flow as the company reports it was $0.24B.
Quarterly history
| Quarter | Form | Filed | Revenue | Y/Y | Op. margin | Net earnings | Op. cash flow |
|---|---|---|---|---|---|---|---|
| Q3 2026 | 10-Q | Nov 5, 2026 | $1.4B | +43% | 23.1% | $237M | $292M |
| Q2 2026 | 10-Q | Aug 6, 2026 | $1.2B | +28% | 20.1% | $175M | $243M |
| Q1 2026 | 10-Q | May 7, 2026 | $1.1B | +15% | 13.8% | $84.0M | $53.0M |
| Q4 2025 | 10-K | Feb 24, 2026 | $1.0B | +11% | 13.8% | $107M | $142M |
| Q3 2025 | 10-Q | Nov 6, 2025 | $988M | +10% | 14.0% | $74.0M | $197M |
| Q2 2025 | 10-Q | Aug 7, 2025 | $973M | +10% | 13.9% | $62.0M | $165M |
| Q1 2025 | 10-Q | May 8, 2025 | $936M | +8% | 11.9% | $52.0M | $141M |
Charts
In supply chains and themes
Interactive views
The same charts as the app — open one to draw it.
💵Where each $1 goesinteractive
Loading the interactive chart…
🌏Named in Asian annual reportsinteractive
Loading the interactive chart…
🔄Rotation against the market and its industry (RRG)interactive
Loading the interactive chart…
🔍Earnings qualityinteractive
Loading the interactive chart…
⚖️Fair value by methodinteractive
Loading the interactive chart…
🔭Outlook & guidanceinteractive
Loading the interactive chart…
📈Investments: gains and what it boughtinteractive
Loading the interactive chart…
🏭Its industry’s money flow (input-output)interactive
Loading the interactive chart…
About MKS
MKS Inc. (NASDAQ: MKSI) enables technologies that transform our world. We deliver foundational technology solutions to leading edge semiconductor manufacturing, electronics and packaging, and specialty industrial applications. We apply our broad science and engineering capabilities to create instruments, subsystems, systems, process control solutions and specialty chemicals technology that improve process performance, optimize productivity and enable unique innovations for many of the world's leading technology and industrial companies. Our solutions are critical to addressing the challenges of miniaturization and complexity in advanced device manufacturing by enabling increased power, speed, feature enhancement, and optimized connectivity. Our solutions are also critical to addressing ever-increasing performance requirements across a wide array of specialty industrial applications.
In its own words, from its 8-K, filed Aug 5, 2026.
MKS against its Industrial Instruments For Measurement, Display, and Control peers
The largest companies of the same SEC industry, each at its latest quarter. Revenue growth: +43% against the peers' median +13%. Operating margin: 23.1% against the peers' median 23.1%.
| Company | Quarter | Revenue | Y/Y | Op. margin |
|---|---|---|---|---|
| MKSI MKS | Q3 2026 | $1.4B | +43% | 23.1% |
| DHR Danaher | Q3 2026 | $6.6B | +8% | 19.0% |
| AME Ametek | Q3 2026 | $2.2B | +17% | 26.3% |
| ROP Roper Technologies | Q3 2026 | $2.2B | +8% | 28.7% |
| KEYS Keysight Technologies | Q3 FY26 | $1.8B | +36% | 25.0% |
| FTV Fortive | Q3 2026 | $1.1B | +8% | 21.3% |
| ST Sensata Technologies Holding | Q3 2026 | $1.0B | +8% | 17.5% |
| RAL Ralliant | Q3 2026 | $620M | +17% | 18.9% |
| CGNX Cognex | Q3 2026 | $313M | +13% | 32.2% |
Source: MKS 10-Q on SEC EDGAR · CIK 1049502 · Industrial Instruments For Measurement, Display, and Control
Guidance and outlook
13F: who owns MKSI and who is buying
More on MKSI
History
Every quarter: Q3 2026 results · Q2 2026 results · Q1 2026 results · Q4 2025 results · Q3 2025 results · Q2 2025 results · Q1 2025 results
- MKS guidance history: guided vs reported
- MKS gross margin by quarter
- MKS operating margin by quarter
- MKS net income by quarter
- MKS free cash flow by quarter
- MKS R&D spending by quarter
- MKS capital expenditures by quarter
- MKS Semiconductor revenue by quarter
- MKS Electronics and Packaging revenue by quarter
- MKS Specialty Industrial revenue by quarter