Filing Flows › Industrials › Roper Technologies (ROP)
Roper Technologies (ROP) earnings and revenue breakdown
Latest: Q3 2026 · 10-Q filed Nov 2, 2026 · Roper Technologies (ROP) Q3 2026 earnings results →
Q3 2026 Revenue up 8% year over year to $2.2B · 22¢ of every $1 of revenue kept as net profit · operating margin 28.7%
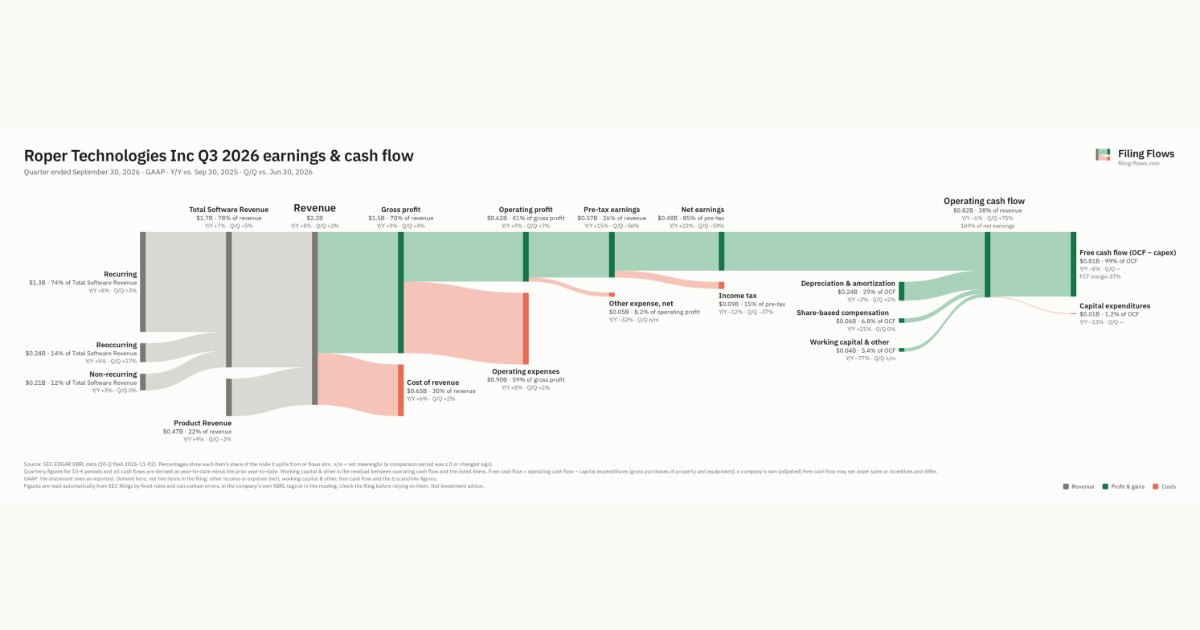
Roper Technologies made $2.2B in Q3 2026 (+8% Y/Y): Total Software Revenue $1.7B, Product Revenue $471M. Operating margin 28.7%, net earnings $485M. See where every dollar goes — costs, profit and cash — as a Sankey from the 10-Q filed Nov 2, 2026.
Drawing the Sankey…
Open the interactive Sankey → click any line for what the company wrote about it, compare Y/Y and Q/Q, export as PNG or PDF
What changed this quarter
Revenue was $2.2B in Q3 2026, up 8% year over year and up 3% from the previous quarter. Recurring was the largest line at 58% of revenue. Recurring added $0.10B year over year (up 8%), 63% of the total change.
Gross margin was 70.1%, up 0.6 points from Q3 2025. Operating profit was $0.62B, a 28.7% margin (up 0.3 points year over year). Of the extra revenue versus Q3 2025, 33% reached operating profit, above the 28% margin then. Operating expenses grew 8% against revenue growth of 8%. Net earnings were $0.48B, up 22% year over year. The effective tax rate was 15.3%.
Operating cash flow was $0.82B (down 6% year over year), 169% of net earnings. Non-cash charges added back $0.24B of depreciation and amortization and $0.06B of share-based compensation. Working capital and other items added $0.04B. Capital expenditures of $0.01B left free cash flow of $0.81B.
Quarterly history
| Quarter | Form | Filed | Revenue | Y/Y | Op. margin | Net earnings | Op. cash flow |
|---|---|---|---|---|---|---|---|
| Q3 2026 | 10-Q | Nov 2, 2026 | $2.2B | +8% | 28.7% | $485M | $821M |
| Q2 2026 | 10-Q | Jul 31, 2026 | $2.1B | +8% | 27.7% | $1.2B | $470M |
| Q1 2026 | 10-Q | May 1, 2026 | $2.1B | +11% | 27.2% | $509M | $592M |
| Q4 2025 | 10-K | Feb 24, 2026 | $2.1B | +10% | 28.6% | $428M | $738M |
| Q3 2025 | 10-Q | Oct 31, 2025 | $2.0B | +14% | 28.4% | $398M | $870M |
| Q2 2025 | 10-Q | Aug 1, 2025 | $1.9B | +13% | 28.2% | $378M | $404M |
| Q1 2025 | 10-Q | May 2, 2025 | $1.9B | +12% | 27.9% | $331M | $529M |
Charts
Interactive views
The same charts as the app — open one to draw it.
💵Where each $1 goesinteractive
Loading the interactive chart…
🌏Named in Asian annual reportsinteractive
Loading the interactive chart…
🔄Rotation against the market and its industry (RRG)interactive
Loading the interactive chart…
🔍Earnings qualityinteractive
Loading the interactive chart…
⚖️Fair value by methodinteractive
Loading the interactive chart…
🔭Outlook & guidanceinteractive
Loading the interactive chart…
📈Investments: gains and what it boughtinteractive
Loading the interactive chart…
🏭Its industry’s money flow (input-output)interactive
Loading the interactive chart…
About Roper Technologies
Roper Technologies, Inc. (“Roper,” the “Company,” “we,” “our,” or “us”) is a diversified technology company. Roper has a proven, long-term, successful track record of compounding cash flow and increasing shareholder value. We operate market leading businesses that design and develop vertical software and technology enabled products for a variety of defensible niche markets. We pursue consistent and sustainable growth in revenue, earnings, and cash flow by enabling continuous improvement in the operating performance of our businesses and by acquiring businesses that offer high value-added software, services, technology-enabled products, and solutions that we believe are capable of realizing growth while maintaining high margins. We compete in many defensible niche markets and believe we are the market leader or a competitive alternative to the market leader in most of these markets.
In its own words, from its 10-K, filed Feb 24, 2026.
Roper Technologies against its Industrial Instruments For Measurement, Display, and Control peers
The largest companies of the same SEC industry, each at its latest quarter. Revenue growth: +8% against the peers' median +13%. Operating margin: 28.7% against the peers' median 23.1%.
| Company | Quarter | Revenue | Y/Y | Op. margin |
|---|---|---|---|---|
| ROP Roper Technologies | Q3 2026 | $2.2B | +8% | 28.7% |
| DHR Danaher | Q3 2026 | $6.6B | +8% | 19.0% |
| AME Ametek | Q3 2026 | $2.2B | +17% | 26.3% |
| KEYS Keysight Technologies | Q3 FY26 | $1.8B | +36% | 25.0% |
| MKSI MKS | Q3 2026 | $1.4B | +43% | 23.1% |
| FTV Fortive | Q3 2026 | $1.1B | +8% | 21.3% |
| ST Sensata Technologies Holding | Q3 2026 | $1.0B | +8% | 17.5% |
| RAL Ralliant | Q3 2026 | $620M | +17% | 18.9% |
| CGNX Cognex | Q3 2026 | $313M | +13% | 32.2% |
Source: Roper Technologies 10-Q on SEC EDGAR · CIK 882835 · Industrial Instruments For Measurement, Display, and Control
Guidance and outlook
13F: who owns ROP and who is buying
More on ROP
History
Every quarter: Q3 2026 results · Q2 2026 results · Q1 2026 results · Q4 2025 results · Q3 2025 results · Q2 2025 results · Q1 2025 results
- Roper Technologies gross margin by quarter
- Roper Technologies operating margin by quarter
- Roper Technologies net income by quarter
- Roper Technologies free cash flow by quarter
- Roper Technologies capital expenditures by quarter
- Roper Technologies Total Software Revenue revenue by quarter
- Roper Technologies Product Revenue revenue by quarter