Filing Flows › Materials › Sonoco Products (SON)
Sonoco Products (SON) earnings and revenue breakdown
Latest: Q3 2026 · 10-Q filed Oct 28, 2026 · Sonoco Products (SON) Q3 2026 earnings results →
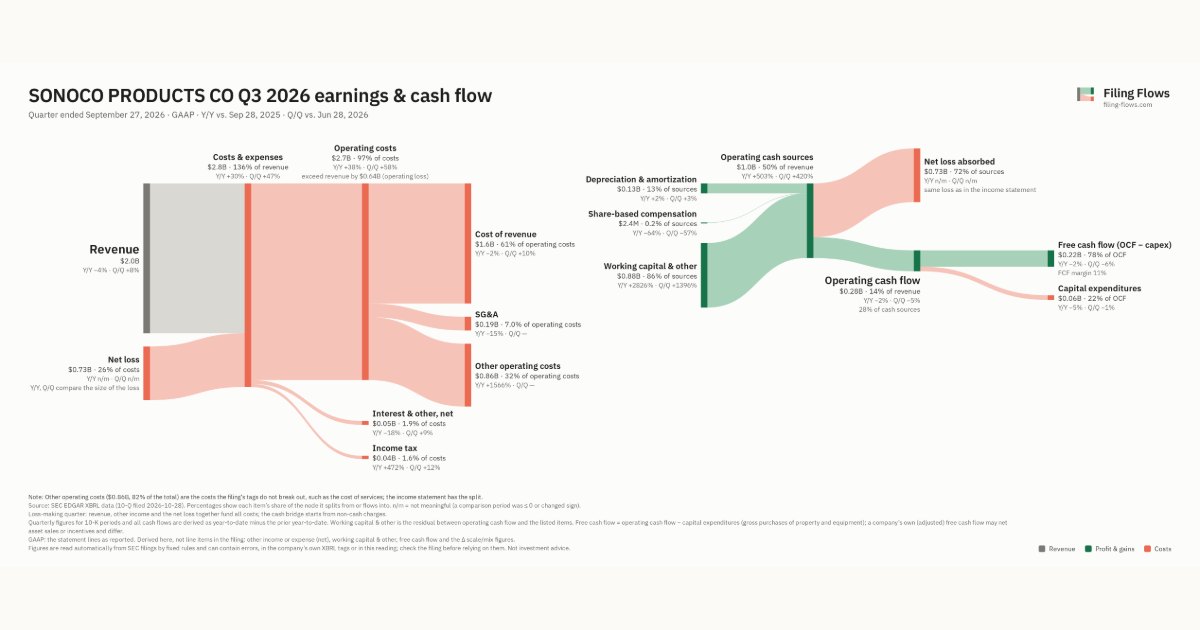
Q3 2026 Revenue down 4% year over year to $2.0B · 36¢ of every $1 of revenue lost · operating margin -31.2%
Sonoco Products made $2.0B in Q3 2026 (-4% Y/Y). Operating margin -31.2%, net loss $732M. See where every dollar goes — costs, profit and cash — as a Sankey from the 10-Q filed Oct 28, 2026.
Drawing the Sankey…
Open the interactive Sankey → click any line for what the company wrote about it, compare Y/Y and Q/Q, export as PNG or PDF
What changed this quarter
Revenue was $2.0B in Q3 2026, down 4% year over year and up 8% from the previous quarter.
Gross margin was 19.9%, down 2.1 points from Q3 2025. Operating costs exceeded revenue by $0.64B, an operating margin of -31.2%. Operating expenses grew 283% against a revenue fall of 4%. The fastest-growing cost line was Other operating costs (+1566%). The quarter ended with a net loss of $0.73B, after a profit of $0.11B the previous quarter.
Operating cash flow was $0.28B (down 2% year over year). Non-cash charges added back $0.13B of depreciation and amortization and $2.4M of share-based compensation. Working capital and other items added $0.88B. Capital expenditures of $0.06B left free cash flow of $0.22B.
Quarterly history
| Quarter | Form | Filed | Revenue | Y/Y | Op. margin | Net earnings | Op. cash flow |
|---|---|---|---|---|---|---|---|
| Q3 2026 | 10-Q | Oct 28, 2026 | $2.0B | -4% | -31.2% | −$732M | $285M |
| Q2 2026 | 10-Q | Jul 28, 2026 | $1.9B | -1% | 10.2% | $105M | $301M |
| Q1 2026 | 10-Q | Apr 28, 2026 | $1.7B | -2% | 7.6% | $67.6M | −$368M |
| Q4 2025 | 10-K | Feb 26, 2026 | $1.8B | +30% | 29.4% | $333M | $413M |
| Q3 2025 | 10-Q | Oct 29, 2025 | $2.1B | +57% | 9.1% | $123M | $292M |
| Q2 2025 | 10-Q | Jul 28, 2025 | $1.9B | +49% | 9.2% | $493M | $193M |
| Q1 2025 | 10-Q | May 2, 2025 | $1.7B | +31% | 7.4% | $54.5M | −$208M |
Charts
Interactive views
The same charts as the app — open one to draw it.
💵Where each $1 goesinteractive
Loading the interactive chart…
🌏Named in Asian annual reportsinteractive
Loading the interactive chart…
🔄Rotation against the market and its industry (RRG)interactive
Loading the interactive chart…
🔍Earnings qualityinteractive
Loading the interactive chart…
⚖️Fair value by methodinteractive
Loading the interactive chart…
🔭Outlook & guidanceinteractive
Loading the interactive chart…
📈Investments: gains and what it boughtinteractive
Loading the interactive chart…
🏭Its industry’s money flow (input-output)interactive
Loading the interactive chart…
About Sonoco Products
Sonoco Products Company (“Sonoco,” “the Company,” “we,” “us,” or “our”) is a South Carolina corporation founded in Hartsville, South Carolina, in 1899 as the Southern Novelty Company with the guiding principle that People Build Businesses by doing the right things. At its beginnings in 1899, a team of 12 people worked from a rented warehouse to produce the Company’s first product, a cone-shaped paper yarn carrier used for winding and transporting yarn. Since most of the textile cones of that day were wooden, paper cones were a novelty. The Company soon became the leading producer of cones in the United States. The Southern Novelty Company continued to diversify its product line and add new operations around the country. In 1923, the Southern Novelty Company name was changed to Sonoco Products Company, or “Sonoco,” using the first two letters from each word of its original name.
In its own words, from its 10-K, filed Feb 26, 2026.
Sonoco Products against its Paperboard Containers & Boxes peers
The largest companies of the same SEC industry, each at its latest quarter. Revenue growth: -4% against the peers' median +0.1%. Operating margin: -31.2% against the peers' median 4.6%.
| Company | Quarter | Revenue | Y/Y | Op. margin |
|---|---|---|---|---|
| SON Sonoco Products | Q3 2026 | $2.0B | -4% | -31.2% |
| SW Smurfit Westrock | Q3 2026 | $8.2B | +2% | 6.0% |
| PKG Packaging Corp of America | Q3 2026 | $2.6B | +12% | 14.8% |
| GPK Graphic Packaging Holding | Q3 2026 | $2.2B | +0.1% | 4.6% |
| DSS DSS | Q2 2026 | $3.6M | -32% | -105.0% |
Source: Sonoco Products 10-Q on SEC EDGAR · CIK 91767 · Paperboard Containers & Boxes
Guidance and outlook
13F: who owns SON and who is buying
More on SON
- How Sonoco Products makes money: revenue by segment
- Sonoco Products stock forecast, price target and fair value
- Who owns Sonoco Products stock: holders, funds and Congress trades
- Sonoco Products guidance and outlook
- Is Sonoco Products a takeover target? LBO and rumors
- Sonoco Products recalls, complaints and regulation
History
Every quarter: Q3 2026 results · Q2 2026 results · Q1 2026 results · Q4 2025 results · Q3 2025 results · Q2 2025 results · Q1 2025 results