Filing Flows › Utilities › Sempra (SRE)
Sempra (SRE) earnings and revenue breakdown
Latest: Q3 2026 · 10-Q filed Nov 5, 2026 · Sempra (SRE) Q3 2026 earnings results →
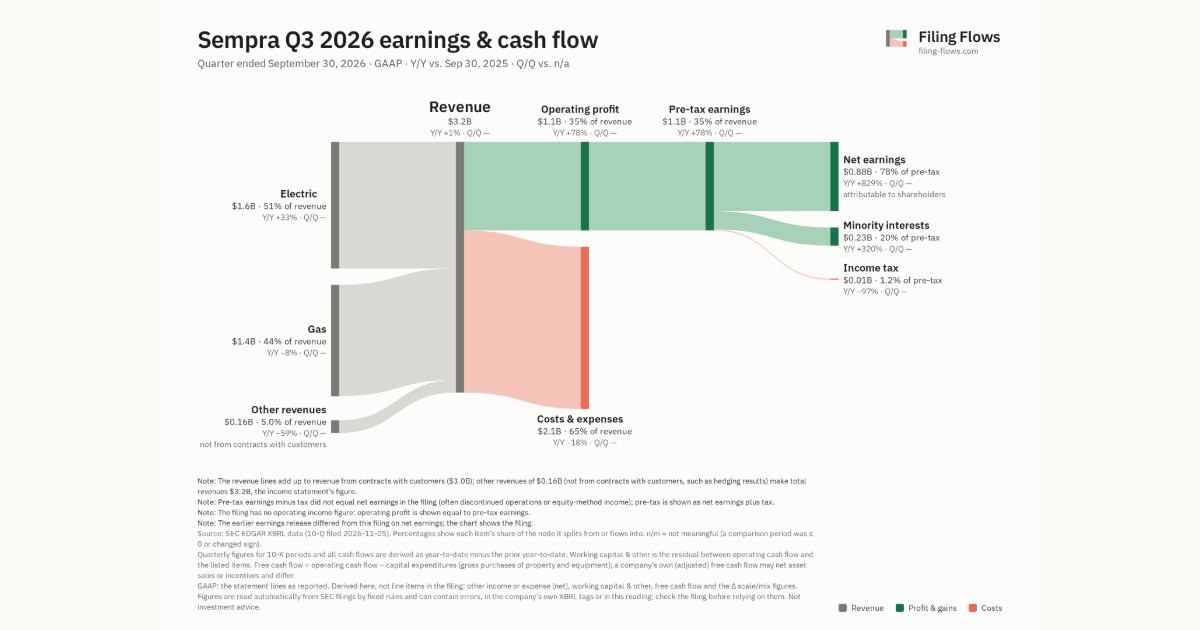
Q3 2026 Revenue up 1% year over year to $3.2B · 28¢ of every $1 of revenue kept as net profit · operating margin 35.3%
Sempra made $3.2B in Q3 2026 (+1% Y/Y): Electric $1.6B, Gas $1.4B, Other revenues $161M. Operating margin 35.3%, net earnings $883M. See where every dollar goes — costs, profit and cash — as a Sankey from the 10-Q filed Nov 5, 2026.
Drawing the Sankey…
Open the interactive Sankey → click any line for what the company wrote about it, compare Y/Y and Q/Q, export as PNG or PDF
What changed this quarter
Revenue was $3.2B in Q3 2026, up 1% year over year. Electric was the largest line at 51% of revenue. Electric added $0.40B year over year (up 33%), 1000% of the total change. Gas declined 8%.
Operating profit was $1.1B, a 35.3% margin (up 15.3 points year over year). Of the extra revenue versus Q3 2025, 1240% reached operating profit, above the 20% margin then. Total costs fell 18% while revenue rose 1%. Net earnings were $0.88B, up 829% year over year. The effective tax rate was 1.2%.
Operating cash flow was $1.6B (up 41% year over year), 140% of net income including minority interests. Non-cash charges added back $0.63B of depreciation and amortization and $0.02B of share-based compensation. Working capital and other items used $0.20B. Capital expenditures of $2.6B exceeded it, leaving free cash flow of −$1.1B.
Quarterly history
| Quarter | Form | Filed | Revenue | Y/Y | Op. margin | Net earnings | Op. cash flow |
|---|---|---|---|---|---|---|---|
| Q3 2026 | 10-Q | Nov 5, 2026 | $3.2B | +1% | 35.3% | $883M | $1.6B |
| Q2 2026 | 10-Q | Aug 6, 2026 | $3.0B | -0.1% | 35.2% | $797M | $1.3B |
| Q1 2026 | 10-Q | May 7, 2026 | $3.7B | -4% | 33.2% | $1.0B | $1.8B |
| Q4 2025 | 10-K | Feb 26, 2026 | $3.7B | -0.2% | 12.6% | $352M | $1.2B |
| Q3 2025 | 10-Q | Nov 5, 2025 | $3.2B | +14% | 20.1% | $95.0M | $1.1B |
| Q2 2025 | 10-Q | Aug 7, 2025 | $3.0B | -0.4% | 23.0% | $473M | $784M |
| Q1 2025 | 10-Q | May 8, 2025 | $3.8B | +4% | 25.7% | $917M | $1.5B |
Charts
In supply chains and themes
Interactive views
The same charts as the app — open one to draw it.
💵Where each $1 goesinteractive
Loading the interactive chart…
🌏Named in Asian annual reportsinteractive
Loading the interactive chart…
🔄Rotation against the market and its industry (RRG)interactive
Loading the interactive chart…
🔍Earnings qualityinteractive
Loading the interactive chart…
⚖️Fair value by methodinteractive
Loading the interactive chart…
🔭Outlook & guidanceinteractive
Loading the interactive chart…
📈Investments: gains and what it boughtinteractive
Loading the interactive chart…
🏭Its industry’s money flow (input-output)interactive
Loading the interactive chart…
About Sempra
We are a holding company whose principal businesses are regulated utilities in California and Texas. Our businesses invest in and operate electric and gas utilities and other energy infrastructure that provide energy services to customers. Sempra was formed in 1998 through a business combination of Enova Corporation and Pacific Enterprises, the holding companies of our regulated public utilities in California: SDG&E, which began operations in 1881, and SoCalGas, which began operations in 1867. We have since expanded our regulated public utility presence into Texas through our 80.25% interest in Oncor and 50% interest in Sharyland Utilities. Sempra Infrastructure’s assets include investments in the U.S. and Mexico with a focus on LNG, energy networks and low carbon solutions.
In its own words, from its 10-K, filed Feb 26, 2026.
Sempra against its Gas & Other Services Combined peers
The largest companies of the same SEC industry, each at its latest quarter. Revenue growth: +1% against the peers' median +4%. Operating margin: 35.3% against the peers' median -0.1%.
| Company | Quarter | Revenue | Y/Y | Op. margin |
|---|---|---|---|---|
| SRE Sempra | Q3 2026 | $3.2B | +1% | 35.3% |
| UGI UGI | Q3 FY26 | $1.3B | -4% | -3.3% |
| CLNE Clean Energy Fuels | Q3 2026 | $112M | +6% | 0.9% |
| OPAL Opal Fuels | Q2 2026 | $83.4M | +4% | -3.6% |
| MNTK Montauk Renewables | Q2 2026 | $54.0M | +20% | -0.1% |
Source: Sempra 10-Q on SEC EDGAR · CIK 1032208 · Gas & Other Services Combined
Guidance and outlook
13F: who owns SRE and who is buying
More on SRE
History
Every quarter: Q3 2026 results · Q2 2026 results · Q1 2026 results · Q4 2025 results · Q3 2025 results · Q2 2025 results · Q1 2025 results