Filing Flows

Filing Flows › Chains › Power grid & electrification

Power grid & electrification

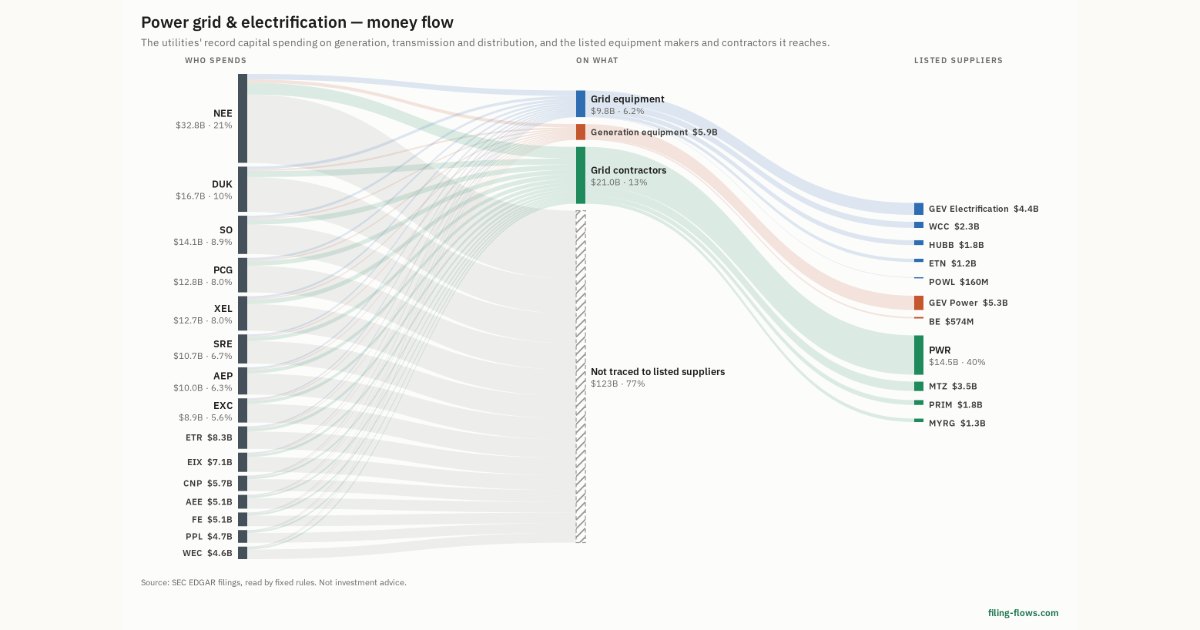
The utilities' record capital spending on generation, transmission and distribution, and the listed equipment makers and contractors it reaches.

$159.4B spent in the last twelve months by NEE, DUK, SO, AEP, EXC, XEL, ETR, PCG, SRE, EIX, WEC, PPL, CNP, AEE, FE; $36.7B traced to 11 listed suppliers. Trailing twelve months to Sep 30, 2026, from SEC filings.

Open the interactive money-flow chart →

Power grid & electrification money flow chart
The money-flow chart (open the interactive one above).
Power grid & electrification: the largest companies by revenue in the chainPower grid & electrification: the largest companies by revenue in the chainPWR · Quanta Services$14.5BGEV · GE Vernova$5.3BGEV · GE Vernova$4.4BMTZ · Mastec$3.5BWCC · Wesco International$2.3BHUBB · Hubbell$1.8BPRIM · Primoris Services$1.8BMYRG · MYR$1.3BETN · Eaton$1.2BBE · Bloom Energy$574MPOWL · Powell Industries$160M

The theme quarter by quarter

Power grid & electrification: the chain's revenue by calendar quarterPower grid & electrification: the chain's revenue by calendar quarter$5.7BQ4 2023$5.1BQ1 2024$5.6BQ2 2024$6.1BQ3 2024$6.2BQ4 2024$5.8BQ1 2025$6.5BQ2 2025$7.1BQ3 2025$7.0BQ4 2025$7.0BQ1 2026$8.2BQ2 2026$9.8BQ3 2026
Each supplier's quarterly revenue scaled by the share of it this chain takes (its attributed share of the trailing twelve months), summed; 9 companies in the latest quarter, +37% against a year earlier.
Power grid & electrification: the buyers' capital spending by calendar quarterPower grid & electrification: the buyers' capital spending by calendar quarter$21.6BQ2 2023$21.4BQ3 2023$22.2BQ4 2023$20.4BQ1 2024$21.1BQ2 2024$22.3BQ3 2024$26.3BQ4 2024$24.3BQ1 2025$26.7BQ2 2025$29.0BQ3 2025$32.2BQ4 2025$30.8BQ1 2026
Capital expenditures of the chain's buyers from their cash-flow statements, by calendar quarter; 14 companies in the latest quarter, +27% against a year earlier.
Companies