Filing Flows › Technology › Hubbell (HUBB)
Hubbell (HUBB) earnings and revenue breakdown
Latest: Q3 2026 · 10-Q filed Oct 28, 2026 · Hubbell (HUBB) Q3 2026 earnings results →
Q3 2026 Revenue up 25% year over year to $1.9B · 14¢ of every $1 of revenue kept as net profit · operating margin 21.8%
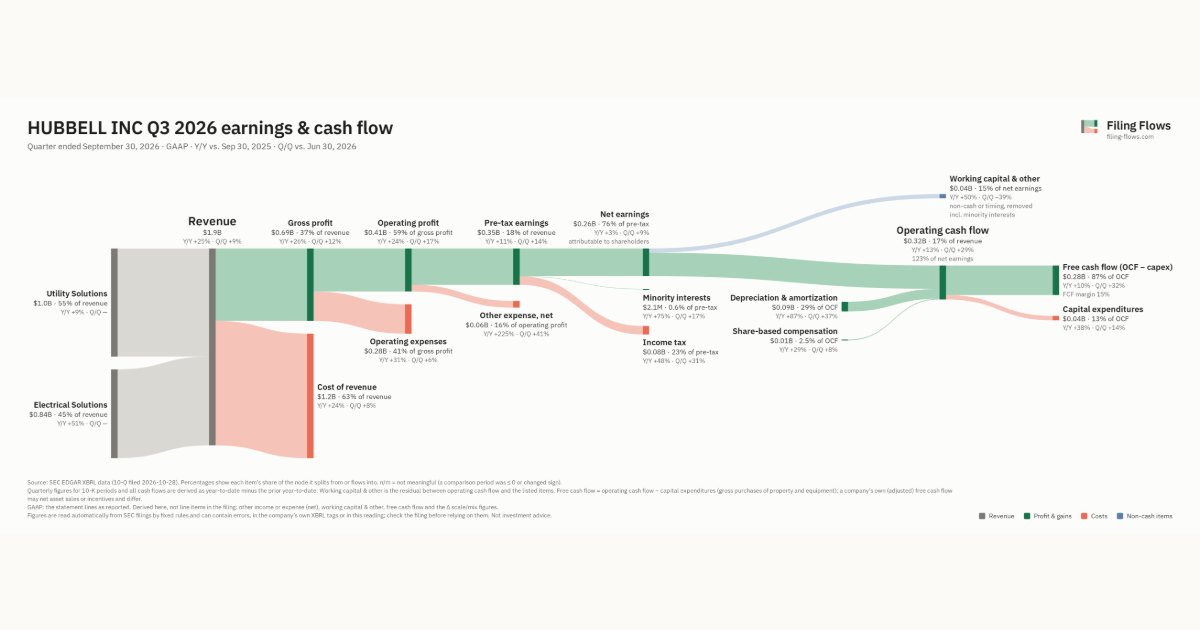
Hubbell made $1.9B in Q3 2026 (+25% Y/Y): Utility Solutions $1.0B, Electrical Solutions $845M. Operating margin 21.8%, net earnings $262M. See where every dollar goes — costs, profit and cash — as a Sankey from the 10-Q filed Oct 28, 2026.
Drawing the Sankey…
Open the interactive Sankey → click any line for what the company wrote about it, compare Y/Y and Q/Q, export as PNG or PDF
What changed this quarter
Revenue was $1.9B in Q3 2026, up 25% year over year and up 9% from the previous quarter. Utility Solutions was the largest line at 55% of revenue. Electrical Solutions added $0.29B year over year (up 51%), 77% of the total change.
Gross margin was 36.8%, up 0.5 points from Q3 2025. Operating profit was $0.41B, a 21.8% margin (down 0.2 points year over year). Of the extra revenue versus Q3 2025, 21% reached operating profit, below the 22% margin then. Operating expenses grew 31% against revenue growth of 25%. Net earnings were $0.26B, up 3% year over year. The effective tax rate was 23.4%.
Operating cash flow was $0.32B (up 13% year over year), 122% of net earnings. Non-cash charges added back $0.09B of depreciation and amortization and $0.01B of share-based compensation. Working capital and other items used $0.04B. Capital expenditures of $0.04B left free cash flow of $0.28B.
Quarterly history
| Quarter | Form | Filed | Revenue | Y/Y | Op. margin | Net earnings | Op. cash flow |
|---|---|---|---|---|---|---|---|
| Q3 2026 | 10-Q | Oct 28, 2026 | $1.9B | +25% | 21.8% | $262M | $323M |
| Q2 2026 | 10-Q | Jul 29, 2026 | $1.7B | +15% | 20.4% | $240M | $250M |
| Q1 2026 | 10-Q | May 1, 2026 | $1.5B | +11% | 17.4% | $183M | $86.6M |
| Q4 2025 | 10-K | Feb 12, 2026 | $1.5B | +12% | 20.9% | $225M | $448M |
| Q3 2025 | 10-Q | Oct 29, 2025 | $1.5B | +4% | 22.0% | $256M | $284M |
| Q2 2025 | 10-Q | Jul 30, 2025 | $1.5B | +2% | 22.7% | $244M | $261M |
| Q1 2025 | 10-Q | May 2, 2025 | $1.4B | -2% | 16.9% | $164M | $37.4M |
Charts
In supply chains and themes
Interactive views
The same charts as the app — open one to draw it.
💵Where each $1 goesinteractive
Loading the interactive chart…
🌏Named in Asian annual reportsinteractive
Loading the interactive chart…
🔄Rotation against the market and its industry (RRG)interactive
Loading the interactive chart…
🔍Earnings qualityinteractive
Loading the interactive chart…
⚖️Fair value by methodinteractive
Loading the interactive chart…
🔭Outlook & guidanceinteractive
Loading the interactive chart…
📈Investments: gains and what it boughtinteractive
Loading the interactive chart…
🏭Its industry’s money flow (input-output)interactive
Loading the interactive chart…
About Hubbell
Hubbell Incorporated (herein referred to as “Hubbell”, the “Company”, the “registrant”, “we”, “our” or “us”, which references shall include its divisions and subsidiaries as the context may require) was founded as a proprietorship in 1888, and was incorporated in Connecticut in 1905. Recognized for our innovation, quality, and deep commitment to serving our customers for over 135 years, Hubbell is a world-class manufacturer of electrical and utility solutions, with more than 75 brands used around the world. We provide utility and electrical solutions that enable our customers to operate critical infrastructure reliably and efficiently, and we empower and energize communities through innovative solutions supporting energy infrastructure In Front of the Meter, on The Edge, and Behind the Meter. In Front of the Meter is where utilities transmit and distribute energy to their customers.
In its own words, from its 10-K, filed Feb 12, 2026.
Hubbell against its Electronic Components & Accessories peers
The largest companies of the same SEC industry, each at its latest quarter. Revenue growth: +25% against the peers' median +15%. Operating margin: 21.8% against the peers' median 9.4%.
| Company | Quarter | Revenue | Y/Y | Op. margin |
|---|---|---|---|---|
| HUBB Hubbell | Q3 2026 | $1.9B | +25% | 21.8% |
| VSH Vishay Intertechnology | Q3 2026 | $979M | +24% | 9.4% |
| MRCY Mercury Systems | Q4 FY26 | $290M | +6% | 5.0% |
| OLED Universal Display | Q3 2026 | $160M | +15% | 33.5% |
| VPG Vishay Precision Group | Q3 2026 | $85.1M | +7% | 3.2% |
| KULR Kulr Technology Group | Q2 2026 | $2.1M | -43% | -538.6% |
Source: Hubbell 10-Q on SEC EDGAR · CIK 48898 · Electronic Components & Accessories
Guidance and outlook
13F: who owns HUBB and who is buying
More on HUBB
History
Every quarter: Q3 2026 results · Q2 2026 results · Q1 2026 results · Q4 2025 results · Q3 2025 results · Q2 2025 results · Q1 2025 results
- Hubbell guidance history: guided vs reported
- Hubbell gross margin by quarter
- Hubbell operating margin by quarter
- Hubbell net income by quarter
- Hubbell free cash flow by quarter
- Hubbell capital expenditures by quarter
- Hubbell Utility Solutions revenue by quarter
- Hubbell Electrical Solutions revenue by quarter