Filing Flows › Industrials › Eaton (ETN)
Eaton (ETN) earnings and revenue breakdown
Latest: Q3 2026 · 10-Q filed Nov 3, 2026 · Eaton (ETN) Q3 2026 earnings results →
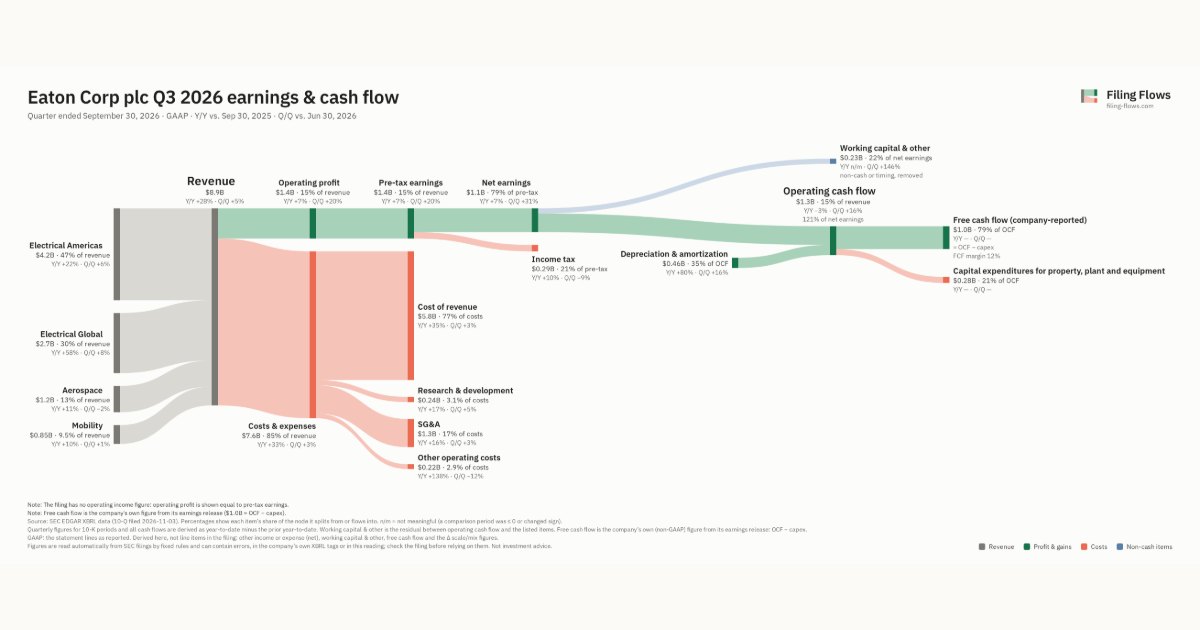
Q3 2026 Revenue up 28% year over year to $8.9B · 12¢ of every $1 of revenue kept as net profit · operating margin 15.3%
Eaton made $8.9B in Q3 2026 (+28% Y/Y): Electrical Americas $4.2B, Electrical Global $2.7B, Aerospace $1.2B. Operating margin 15.3%, net earnings $1.1B. See where every dollar goes — costs, profit and cash — as a Sankey from the 10-Q filed Nov 3, 2026.
Drawing the Sankey…
Open the interactive Sankey → click any line for what the company wrote about it, compare Y/Y and Q/Q, export as PNG or PDF
What changed this quarter
Revenue was $8.9B in Q3 2026, up 28% year over year and up 5% from the previous quarter. Electrical Americas was the largest line at 47% of revenue. Electrical Global added $1.0B year over year (up 58%), 51% of the total change.
Operating profit was $1.4B, a 15.3% margin (down 2.9 points year over year). Of the extra revenue versus Q3 2025, 5% reached operating profit, below the 18% margin then. Total costs grew 33% against revenue growth of 28%. The fastest-growing cost line was Other operating costs (+138%). Net earnings were $1.1B, up 7% year over year. The effective tax rate was 21.2%.
Operating cash flow was $1.3B (down 3% year over year), 121% of net earnings. Non-cash charges added back $0.46B of depreciation and amortization. Working capital and other items used $0.23B. After capital expenditures for property, plant and equipment ($0.28B), free cash flow as the company reports it was $1.0B.
Quarterly history
| Quarter | Form | Filed | Revenue | Y/Y | Op. margin | Net earnings | Op. cash flow |
|---|---|---|---|---|---|---|---|
| Q3 2026 | 10-Q | Nov 3, 2026 | $8.9B | +28% | 15.3% | $1.1B | $1.3B |
| Q2 2026 | 10-Q | Jul 31, 2026 | $8.5B | +21% | 13.4% | $823M | $1.1B |
| Q1 2026 | 10-Q | May 5, 2026 | $7.5B | +17% | 14.9% | $868M | $507M |
| Q4 2025 | 10-K | Feb 26, 2026 | $7.1B | +13% | 18.4% | $1.1B | $2.0B |
| Q3 2025 | 10-Q | Nov 4, 2025 | $7.0B | +10% | 18.2% | $1.0B | $1.4B |
| Q2 2025 | 10-Q | Aug 5, 2025 | $7.0B | +11% | 16.9% | $982M | $918M |
| Q1 2025 | 10-Q | May 2, 2025 | $6.4B | +7% | 18.5% | $965M | $238M |
Charts
In supply chains and themes
Interactive views
The same charts as the app — open one to draw it.
💵Where each $1 goesinteractive
Loading the interactive chart…
🌏Named in Asian annual reportsinteractive
Loading the interactive chart…
🔄Rotation against the market and its industry (RRG)interactive
Loading the interactive chart…
🔍Earnings qualityinteractive
Loading the interactive chart…
⚖️Fair value by methodinteractive
Loading the interactive chart…
🔭Outlook & guidanceinteractive
Loading the interactive chart…
📈Investments: gains and what it boughtinteractive
Loading the interactive chart…
🏭Its industry’s money flow (input-output)interactive
Loading the interactive chart…
About Eaton
Eaton Corporation plc (Eaton or the Company) is an intelligent power management company dedicated to protecting the environment and improving the quality of life for people everywhere. We make products for the data center, utility, industrial, commercial, machine building, residential, aerospace and mobility markets. We are capitalizing on the megatrends of the electrification, digitalization, and the reindustrialization of and growth of megaprojects in North America and increased global infrastructure spending, all of which are expanding our end markets and positioning Eaton for growth for years to come. We are strengthening our participation across the entire electrical power value chain and benefiting from momentum in the data center and utility end markets as well as a growth cycle in the commercial aerospace and defense markets.
In its own words, from its 10-K, filed Feb 26, 2026.
Eaton against its Misc Industrial & Commercial Machinery & Equipment peers
The largest companies of the same SEC industry, each at its latest quarter. Revenue growth: +28% against the peers' median +15%. Operating margin: 15.3% against the peers' median 15.3%.
| Company | Quarter | Revenue | Y/Y | Op. margin |
|---|---|---|---|---|
| ETN Eaton | Q3 2026 | $8.9B | +28% | 15.3% |
| MOG-A Moog | Q3 FY26 | $1.1B | +15% | 15.8% |
| CW Curtiss Wright | Q3 2026 | $953M | +10% | 19.7% |
| EPAC Enerpac Tool Group | Q4 FY26 | $186M | +11% | 18.5% |
| LIQT Liqtech International | Q2 2026 | $4.4M | -12% | -53.4% |
| QIND Quality Industrial | Q2 2026 | $3.5M | -12% | 3.7% |
| NGTF NightFood Holdings | Q4 FY26 | $2.4M | +409% | n/m |
| VHUB VenHub Global | Q2 2026 | $87K | +536% | n/m |
Source: Eaton 10-Q on SEC EDGAR · CIK 1551182 · Misc Industrial & Commercial Machinery & Equipment
Guidance and outlook
More on ETN
History
Every quarter: Q3 2026 results · Q2 2026 results · Q1 2026 results · Q4 2025 results · Q3 2025 results · Q2 2025 results · Q1 2025 results
- Eaton guidance history: guided vs reported
- Eaton operating margin by quarter
- Eaton net income by quarter
- Eaton free cash flow by quarter
- Eaton R&D spending by quarter
- Eaton capital expenditures by quarter
- Eaton Electrical Americas revenue by quarter
- Eaton Electrical Global revenue by quarter
- Eaton Aerospace revenue by quarter