Filing Flows › Industrials › Bloom Energy (BE)
Bloom Energy (BE) earnings and revenue breakdown
Latest: Q3 2026 · 10-Q filed Oct 22, 2026 · Bloom Energy (BE) Q3 2026 earnings results →
Q3 2026 Revenue up 138% year over year to $1.2B · 20¢ of every $1 of revenue kept as net profit · operating margin 18.2%
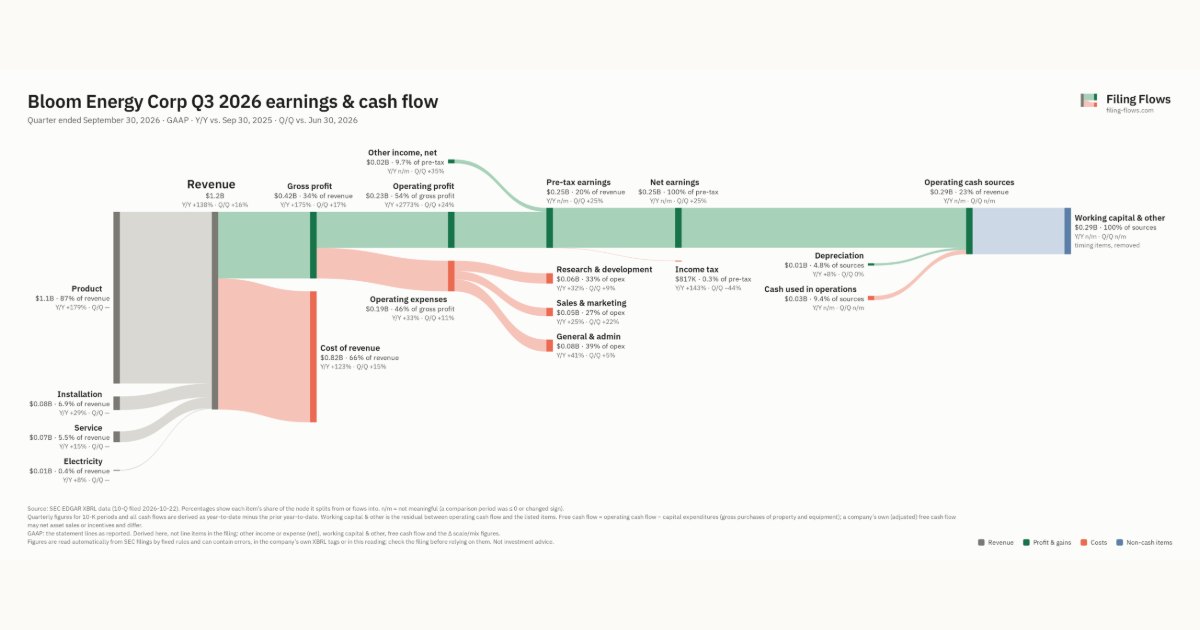
Bloom Energy made $1.2B in Q3 2026 (+138% Y/Y): Product $1.1B, Installation $84.9M, Service $67.6M. Operating margin 18.2%, net earnings $250M. See where every dollar goes — costs, profit and cash — as a Sankey from the 10-Q filed Oct 22, 2026.
Drawing the Sankey…
Open the interactive Sankey → click any line for what the company wrote about it, compare Y/Y and Q/Q, export as PNG or PDF
What changed this quarter
Revenue was $1.2B in Q3 2026, up 138% year over year and up 16% from the previous quarter. Product was the largest line at 87% of revenue. Product added $0.69B year over year (up 179%), 96% of the total change.
Gross margin was 33.8%, up 4.5 points from Q3 2025. Operating profit was $0.23B, a 18.2% margin (up 16.7 points year over year). Of the extra revenue versus Q3 2025, 30% reached operating profit, above the 2% margin then. Operating expenses grew 33% against revenue growth of 138%. The fastest-growing cost line was General & admin (+41%). Net earnings were $0.25B ($0.25B including minority interests, which bore $1.3M of losses). The effective tax rate was 0.3%.
Operating cash flow was −$0.03B. Non-cash charges added back $0.01B of depreciation. Working capital and other items used $0.29B. Capital expenditures of $0.15B exceeded it, leaving free cash flow of −$0.18B.
Quarterly history
| Quarter | Form | Filed | Revenue | Y/Y | Op. margin | Net earnings | Op. cash flow |
|---|---|---|---|---|---|---|---|
| Q3 2026 | 10-Q | Oct 22, 2026 | $1.2B | +138% | 18.2% | $250M | −$27.1M |
| Q2 2026 | 10-Q | Jul 28, 2026 | $1.1B | +166% | 17.1% | $196M | $226M |
| Q1 2026 | 10-Q | Apr 29, 2026 | $751M | +130% | 9.6% | $70.7M | $73.6M |
| Q4 2025 | 10-K | Feb 9, 2026 | $778M | +36% | 11.3% | $1.4M | $418M |
| Q3 2025 | 10-Q | Oct 28, 2025 | $519M | +57% | 1.5% | −$23.0M | $19.7M |
| Q2 2025 | 10-Q | Jul 31, 2025 | $401M | +20% | -0.9% | −$42.2M | −$213M |
| Q1 2025 | 10-Q | Apr 30, 2025 | $326M | +39% | -5.8% | −$23.4M | −$111M |
Charts
In supply chains and themes
Interactive views
The same charts as the app — open one to draw it.
💵Where each $1 goesinteractive
Loading the interactive chart…
🌏Named in Asian annual reportsinteractive
Loading the interactive chart…
🔄Rotation against the market and its industry (RRG)interactive
Loading the interactive chart…
🔍Earnings qualityinteractive
Loading the interactive chart…
⚖️Fair value by methodinteractive
Loading the interactive chart…
🔭Outlook & guidanceinteractive
Loading the interactive chart…
📈Investments: gains and what it boughtinteractive
Loading the interactive chart…
🏭Its industry’s money flow (input-output)interactive
Loading the interactive chart…
About Bloom Energy
Bloom Energy is a global leader in onsite power generation, delivering a foundational platform purpose-built for the digital era and the global energy transition. We manufacture a versatile fuel cell energy platform, supporting the commercial availability of two main products: the Bloom Energy Server® fuel cell system for generating electricity and the Bloom Electrolyzer™ for producing hydrogen. Our primary product, the Bloom Energy Server is a proprietary high-temperature solid-oxide fuel cell technology that converts fuels—including natural gas, biogas, and hydrogen—into electricity at high-density without combustion or moving parts, achieving lower emissions and higher efficiency than legacy systems.
In its own words, from its 10-K, filed Feb 9, 2026.
Bloom Energy against its Electrical Industrial Apparatus peers
The largest companies of the same SEC industry, each at its latest quarter. Revenue growth: +138% against the peers' median +21%. Operating margin: 18.2% against the peers' median 12.4%.
| Company | Quarter | Revenue | Y/Y | Op. margin |
|---|---|---|---|---|
| BE Bloom Energy | Q3 2026 | $1.2B | +138% | 18.2% |
| WWD Woodward | Q3 FY26 | $1.1B | +21% | 17.4% |
| FPS Forgent Power Solutions | Q4 FY26 | $462M | +94% | 19.9% |
| PLUG Plug Power | Q2 2026 | $178M | +2% | -36.0% |
| EAF Graftech International | Q3 2026 | $140M | -3% | -16.2% |
| EROC ERock | Q2 2026 | $39.9M | -42% | -49.8% |
| FCEL Fuelcell Energy | Q3 FY26 | $33.0M | -29% | -141.4% |
| SCIA SCI Engineered Materials | Q3 2026 | $8.1M | +52% | 12.4% |
Source: Bloom Energy 10-Q on SEC EDGAR · CIK 1664703 · Electrical Industrial Apparatus
Guidance and outlook
13F: who owns BE and who is buying
More on BE
History
Every quarter: Q3 2026 results · Q2 2026 results · Q1 2026 results · Q4 2025 results · Q3 2025 results · Q2 2025 results · Q1 2025 results
- Bloom Energy guidance history: guided vs reported
- Bloom Energy gross margin by quarter
- Bloom Energy operating margin by quarter
- Bloom Energy net income by quarter
- Bloom Energy free cash flow by quarter
- Bloom Energy R&D spending by quarter
- Bloom Energy capital expenditures by quarter
- Bloom Energy Product revenue by quarter
- Bloom Energy Installation revenue by quarter
- Bloom Energy Service revenue by quarter