Filing Flows › Communication Services › T-Mobile US (TMUS)
T-Mobile US (TMUS) earnings and revenue breakdown
Latest: Q3 2026 · 10-Q filed Oct 28, 2026 · T-Mobile US (TMUS) Q3 2026 earnings results →
Q3 2026 Revenue up 7% year over year to $23.6B · 15¢ of every $1 of revenue kept as net profit · operating margin 24.0%
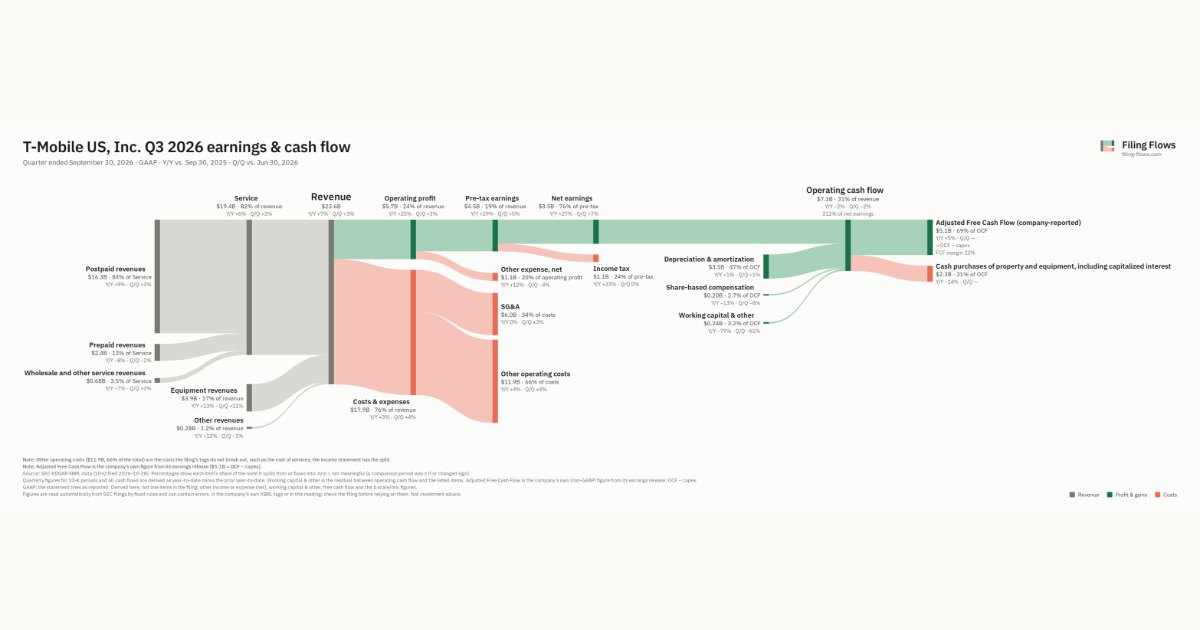
T-Mobile US made $23.6B in Q3 2026 (+7% Y/Y): Service $19.4B, Equipment revenues $3.9B, Other revenues $280M. Operating margin 24.0%, net earnings $3.5B. See where every dollar goes — costs, profit and cash — as a Sankey from the 10-Q filed Oct 28, 2026.
Drawing the Sankey…
Open the interactive Sankey → click any line for what the company wrote about it, compare Y/Y and Q/Q, export as PNG or PDF
What changed this quarter
Revenue was $23.6B in Q3 2026, up 7% year over year and up 3% from the previous quarter. Postpaid revenues was the largest line at 69% of revenue. Postpaid revenues added $1.4B year over year (up 9%), 85% of the total change. Prepaid revenues declined 8%.
Operating profit was $5.7B, a 24.0% margin (up 3.4 points year over year). Of the extra revenue versus Q3 2025, 70% reached operating profit, above the 21% margin then. Total costs grew 3% against revenue growth of 7%. Net earnings were $3.5B, up 27% year over year. The effective tax rate was 23.9%.
Operating cash flow was $7.3B (down 2% year over year), 212% of net earnings. Non-cash charges added back $3.5B of depreciation and amortization and $0.20B of share-based compensation. After cash purchases of property and equipment, including capitalized interest ($2.3B), adjusted free cash flow as the company reports it was $5.1B.
Quarterly history
| Quarter | Form | Filed | Revenue | Y/Y | Op. margin | Net earnings | Op. cash flow |
|---|---|---|---|---|---|---|---|
| Q3 2026 | 10-Q | Oct 28, 2026 | $23.6B | +7% | 24.0% | $3.5B | $7.3B |
| Q2 2026 | 10-Q | Jul 23, 2026 | $22.8B | +8% | 24.1% | $3.2B | $7.5B |
| Q1 2026 | 10-Q | Apr 28, 2026 | $23.1B | +11% | 19.5% | $2.5B | $7.2B |
| Q4 2025 | 10-K | Feb 11, 2026 | $24.3B | +11% | 15.4% | $2.1B | $6.7B |
| Q3 2025 | 10-Q | Oct 23, 2025 | $22.0B | +9% | 20.6% | $2.7B | $7.5B |
| Q2 2025 | 10-Q | Jul 23, 2025 | $21.1B | +7% | 24.7% | $3.2B | $7.0B |
| Q1 2025 | 10-Q | Apr 24, 2025 | $20.9B | +7% | 23.0% | $3.0B | $6.8B |
Charts
Interactive views
The same charts as the app — open one to draw it.
💵Where each $1 goesinteractive
Loading the interactive chart…
🌏Named in Asian annual reportsinteractive
Loading the interactive chart…
🔄Rotation against the market and its industry (RRG)interactive
Loading the interactive chart…
🔍Earnings qualityinteractive
Loading the interactive chart…
⚖️Fair value by methodinteractive
Loading the interactive chart…
🔭Outlook & guidanceinteractive
Loading the interactive chart…
📈Investments: gains and what it boughtinteractive
Loading the interactive chart…
🏭Its industry’s money flow (input-output)interactive
Loading the interactive chart…
Customers and suppliers named in filings
Sells to
Buys from
- INSG — 89% of the supplier’s revenue · Stated in 10-K (sentence) · source
- SBAC — 78% of the supplier’s revenue · Stated in 10-K (XBRL) · source
- CCI — 40% of the supplier’s revenue · Stated in 10-K (XBRL) · source
- AMT — 18% of the supplier’s revenue · Stated in 10-K (customer table) · source
- StratCap Digital Infrastructure REIT, Inc. · Stated in 10-K (named, share not stated) · source
About T-Mobile US
As America’s supercharged Un-carrier, we have disrupted the telecommunications industry by actively engaging with and listening to our customers and focusing on eliminating their pain points. Our customers benefit from what we believe is an unmatched combination of the best value and best network, alongside an unwavering focus on offering them the best possible service experience and an undisputable drive for disruptive innovation in wireless and beyond. This includes providing added value and what we believe is an exceptional experience while implementing signature Un-carrier initiatives that have changed the industry. We ended annual service contracts, overages, unpredictable international roaming fees and data buckets, among other things.
In its own words, from its 10-K, filed Feb 11, 2026.
T-Mobile US against its Radiotelephone Communications peers
The largest companies of the same SEC industry, each at its latest quarter. Revenue growth: +7% against the peers' median +7%. Operating margin: 24.0% against the peers' median 6.1%.
| Company | Quarter | Revenue | Y/Y | Op. margin |
|---|---|---|---|---|
| TMUS T-Mobile US | Q3 2026 | $23.6B | +7% | 24.0% |
| AD Array Digital Infrastructure | Q3 2026 | $53.9M | +14% | -4.3% |
| SPOK Spok Holdings | Q3 2026 | $33.0M | -3% | 17.1% |
| CLRI Cleartronic | Q3 FY26 | $1.2M | +14% | 6.1% |
| SIDU Sidus Space | Q2 2026 | $583K | -54% | -976.2% |
Source: T-Mobile US 10-Q on SEC EDGAR · CIK 1283699 · Radiotelephone Communications
Guidance and outlook
13F: who owns TMUS and who is buying
More on TMUS
History
Every quarter: Q3 2026 results · Q2 2026 results · Q1 2026 results · Q4 2025 results · Q3 2025 results · Q2 2025 results · Q1 2025 results