Filing Flows › Communication Services › EchoStar (ECHO)
EchoStar (ECHO) earnings and revenue breakdown
Latest: Q3 2026 · 10-Q filed Nov 3, 2026 · EchoStar (ECHO) Q3 2026 earnings results →
Q3 2026 Revenue down 69% year over year to $1.1B · 247¢ of every $1 of revenue kept as net profit · operating margin 13.1%
EchoStar made $1.1B in Q3 2026 (-69% Y/Y): Service and other revenue $1.0B, Equipment sales and other revenue $96.7M. Operating margin 13.1%, net earnings $2.8B. See where every dollar goes — costs, profit and cash — as a Sankey from the 10-Q filed Nov 3, 2026.
Drawing the Sankey…
Open the interactive Sankey → click any line for what the company wrote about it, compare Y/Y and Q/Q, export as PNG or PDF
What changed this quarter
Revenue was $1.1B in Q3 2026, down 69% year over year and down 68% from the previous quarter. Service and other revenue was the largest line at 91% of revenue. Service and other revenue lost $2.4B year over year (down 70%), 96% of the total change.
Operating profit was $0.15B, a 13.1% margin (up 473.6 points year over year). Total costs fell 95% while revenue fell 69%. Net earnings were $2.8B. The effective tax rate was 18.1%. Non-operating items added $3.3B, 96% of pre-tax earnings, so the bottom line overstates operating performance.
Operating cash flow was $0.11B (up 1% year over year), 4% of net earnings. Non-cash charges added back $0.09B of depreciation and amortization and $2.6M of share-based compensation. Working capital and other items used $2.8B. Capital expenditures of $0.06B left free cash flow of $0.05B.
Quarterly history
| Quarter | Form | Filed | Revenue | Y/Y | Op. margin | Net earnings | Op. cash flow |
|---|---|---|---|---|---|---|---|
| Q3 2026 | 10-Q | Nov 3, 2026 | $1.1B | -69% | 13.1% | $2.8B | $113M |
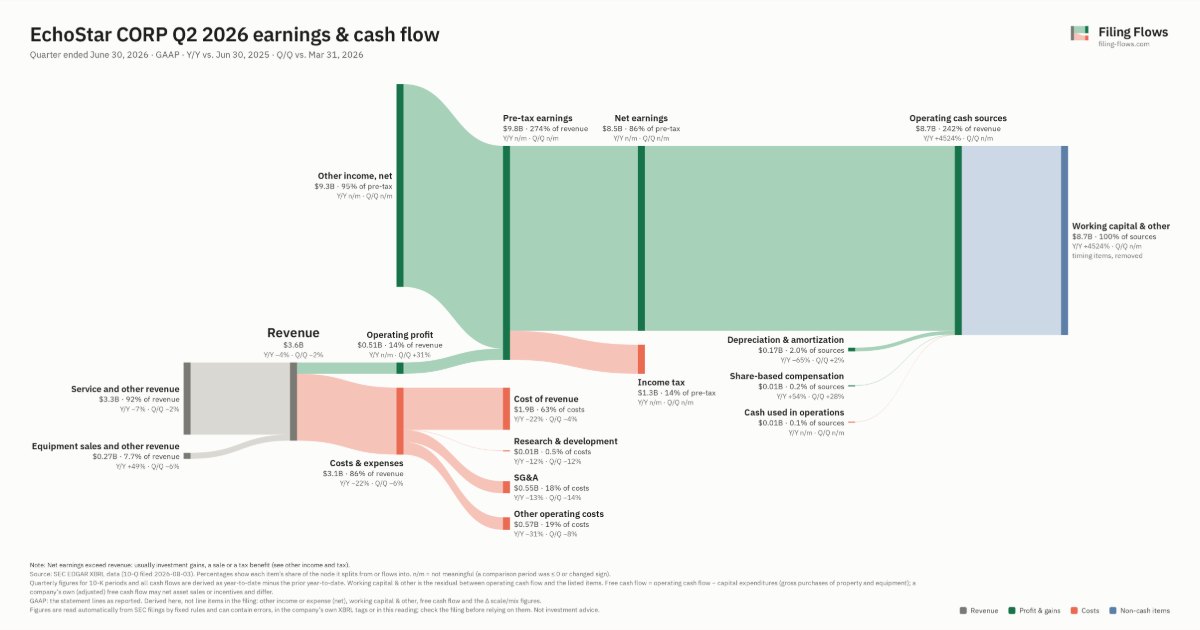
| Q2 2026 | 10-Q | Aug 3, 2026 | $3.6B | -4% | 14.3% | $8.5B | −$10.0M |
| Q1 2026 | 10-Q | May 11, 2026 | $3.7B | -5% | 10.7% | −$147M | $238M |
| Q4 2025 | 10-K | Mar 2, 2026 | $3.8B | -4% | -20.5% | −$1.2B | −$425M |
| Q3 2025 | 10-Q | Nov 6, 2025 | $3.6B | -7% | -460.5% | −$12.8B | $112M |
| Q2 2025 | 10-Q | Aug 1, 2025 | $3.7B | -6% | -5.7% | −$307M | $7.5M |
| Q1 2025 | 10-Q | May 9, 2025 | $3.9B | -4% | -2.3% | −$203M | $207M |
Charts
Interactive views
The same charts as the app — open one to draw it.
💵Where each $1 goesinteractive
Loading the interactive chart…
🌏Named in Asian annual reportsinteractive
Loading the interactive chart…
🔄Rotation against the market and its industry (RRG)interactive
Loading the interactive chart…
🔍Earnings qualityinteractive
Loading the interactive chart…
⚖️Fair value by methodinteractive
Loading the interactive chart…
🔭Outlook & guidanceinteractive
Loading the interactive chart…
📈Investments: gains and what it boughtinteractive
Loading the interactive chart…
🏭Its industry’s money flow (input-output)interactive
Loading the interactive chart…
Customers and suppliers named in filings
Buys from
- T · Stated in 10-K (named, share not stated) · source
- TMUS · Stated in 10-K (named, share not stated) · source
About EchoStar
EchoStar Corporation is a holding company that was organized in October 2007 as a corporation under the laws of the State of Nevada. EchoStar Corporation together with its subsidiaries are referred to as “EchoStar,” the “Company,” “we,” “us” and/or “our,” unless otherwise required by the context. Our Class A common stock is publicly traded on the NASDAQ Global Select Market (“NASDAQ”) under the symbol “SATS.” Our principal executive offices are located at 9601 South Meridian Boulevard, Englewood, Colorado 80112 and our telephone number is (303) 723- 1000.
In its own words, from its 10-K, filed Mar 2, 2026.
EchoStar against its Communications Services, NEC peers
The largest companies of the same SEC industry, each at its latest quarter. Revenue growth: -69% against the peers' median +3%. Operating margin: 13.1% against the peers' median 5.5%.
| Company | Quarter | Revenue | Y/Y | Op. margin |
|---|---|---|---|---|
| ECHO EchoStar | Q3 2026 | $1.1B | -69% | 13.1% |
| VSAT Viasat | Q2 FY27 | $1.2B | +3% | 0.6% |
| CALX Calix | Q3 2026 | $302M | +14% | 5.5% |
| IRDM Iridium Communications | Q3 2026 | $246M | +8% | 12.9% |
| CCOI Cogent Communications Holdings | Q3 2026 | $231M | -4% | -3.0% |
| GOGO Gogo | Q3 2026 | $213M | -5% | 8.0% |
| GSAT Globalstar | Q3 2026 | $70.9M | -4% | 10.7% |
| KVHI KVH Industries | Q3 2026 | $38.4M | +35% | -3.2% |
| ASTS AST SpaceMobile | Q2 2026 | $31.5M | 27× | -948.0% |
Source: EchoStar 10-Q on SEC EDGAR · CIK 1415404 · Communications Services, NEC
13F: who owns ECHO and who is buying
More on ECHO
History
Every quarter: Q3 2026 results · Q2 2026 results · Q1 2026 results · Q4 2025 results · Q3 2025 results · Q2 2025 results · Q1 2025 results