Filing Flows › Communication Services › AT&T (T)
AT&T (T) earnings and revenue breakdown
Latest: Q3 2026 · 10-Q filed Oct 21, 2026 · AT&T (T) Q3 2026 earnings results →
Q3 2026 Revenue up 5% year over year to $32.3B · 3¢ of every $1 of revenue kept as net profit · operating margin 12.7%
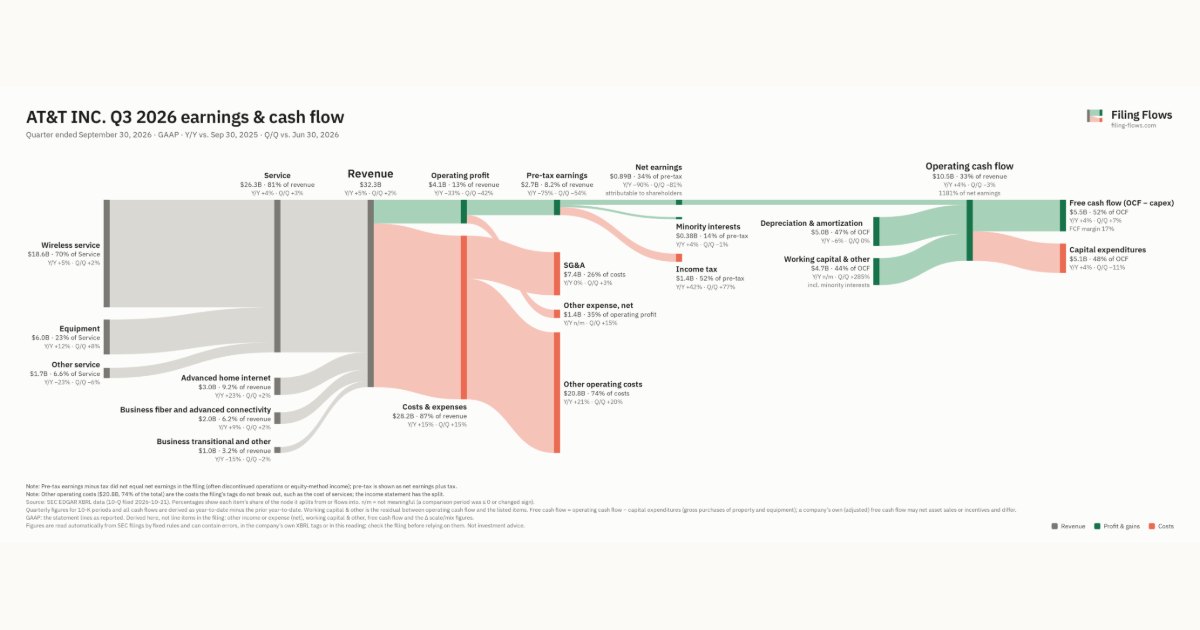
AT&T made $32.3B in Q3 2026 (+5% Y/Y): Service $26.3B, Advanced home internet $3.0B, Business fiber and advanced connectivity $2.0B. Operating margin 12.7%, net earnings $891M. See where every dollar goes — costs, profit and cash — as a Sankey from the 10-Q filed Oct 21, 2026.
Drawing the Sankey…
Open the interactive Sankey → click any line for what the company wrote about it, compare Y/Y and Q/Q, export as PNG or PDF
What changed this quarter
Revenue was $32.3B in Q3 2026, up 5% year over year and up 2% from the previous quarter. Wireless service was the largest line at 57% of revenue. Wireless service added $0.94B year over year (up 5%), 58% of the total change. Other service declined 23%.
Operating profit was $4.1B, a 12.7% margin (down 7.3 points year over year). Operating profit fell $2.0B even though revenue rose $1.6B versus Q3 2025, so costs grew faster than sales. Total costs grew 15% against revenue growth of 5%. The fastest-growing cost line was Other operating costs (+21%). Net earnings were $0.89B, down 90% year over year. The effective tax rate was 52.3%.
Operating cash flow was $10.5B (up 4% year over year), 829% of net income including minority interests. Non-cash charges added back $5.0B of depreciation and amortization. Working capital and other items added $4.3B. Capital expenditures of $5.1B left free cash flow of $5.5B.
Quarterly history
| Quarter | Form | Filed | Revenue | Y/Y | Op. margin | Net earnings | Op. cash flow |
|---|---|---|---|---|---|---|---|
| Q3 2026 | 10-Q | Oct 21, 2026 | $32.3B | +5% | 12.7% | $891M | $10.5B |
| Q2 2026 | 10-Q | Jul 22, 2026 | $31.6B | +2% | 22.3% | $4.6B | $10.8B |
| Q1 2026 | 10-Q | Apr 27, 2026 | $31.5B | +3% | 21.1% | $3.8B | $7.6B |
| Q4 2025 | 10-K | Feb 9, 2026 | $33.5B | +4% | 17.3% | $3.8B | $11.3B |
| Q3 2025 | 10-Q | Oct 31, 2025 | $30.7B | +2% | 19.9% | $9.3B | $10.2B |
| Q2 2025 | 10-Q | Jul 24, 2025 | $30.8B | +4% | 21.1% | $4.5B | $9.8B |
| Q1 2025 | 10-Q | Apr 29, 2025 | $30.6B | +2% | 18.8% | $4.4B | $9.0B |
Charts
Interactive views
The same charts as the app — open one to draw it.
💵Where each $1 goesinteractive
Loading the interactive chart…
🌏Named in Asian annual reportsinteractive
Loading the interactive chart…
🔄Rotation against the market and its industry (RRG)interactive
Loading the interactive chart…
🔍Earnings qualityinteractive
Loading the interactive chart…
⚖️Fair value by methodinteractive
Loading the interactive chart…
🔭Outlook & guidanceinteractive
Loading the interactive chart…
📈Investments: gains and what it boughtinteractive
Loading the interactive chart…
🏭Its industry’s money flow (input-output)interactive
Loading the interactive chart…
Customers and suppliers named in filings
Sells to
- SSTI · Stated in 10-K (named, share not stated) · source
- ECHO · Stated in 10-K (named, share not stated) · source
- SCSC · Stated in 10-K (named, share not stated) · source
Buys from
- StratCap Digital Infrastructure REIT, Inc. — 37% of the supplier’s revenue · Stated in 10-K (sentence) · source
- CCI — 27% of the supplier’s revenue · Stated in 10-K (XBRL) · source
- DY — 25% of the supplier’s revenue · Stated in 10-K (XBRL) · source
- AMT — 17% of the supplier’s revenue · Stated in 10-K (XBRL) · source
- MTZ — 10% of the supplier’s revenue · Stated in 10-K (sentence) · source
About AT&T
AT&T Inc. (“AT&T,” “we” or the “Company”) is a holding company incorporated under the laws of the State of Delaware in 1983 and has its principal executive offices at 208 S. Akard St., Dallas, Texas, 75202 (telephone number 210-821-4105). We maintain an internet website at www.att.com. (This website address is for information only and is not intended to be an active link or to incorporate any website information into this document.) We file electronically with the Securities and Exchange Commission (SEC) required reports on Form 8-K, Form 10-Q and Form 10-K; proxy materials; registration statements on Forms S-3 and S-8, as necessary; and other forms or reports as required. The SEC maintains a website (www.sec.gov) that contains reports, proxy and information statements, and other information regarding issuers that file electronically with the SEC.
In its own words, from its 10-K, filed Feb 9, 2026.
AT&T against its Telephone Communications (No Radiotelephone) peers
The largest companies of the same SEC industry, each at its latest quarter. Revenue growth: +5% against the peers' median +5%. Operating margin: 12.7% against the peers' median 3.5%.
| Company | Quarter | Revenue | Y/Y | Op. margin |
|---|---|---|---|---|
| T AT&T | Q3 2026 | $32.3B | +5% | 12.7% |
| VZ Verizon Communications | Q3 2026 | $34.3B | +2% | 25.2% |
| LUMN Lumen Technologies | Q3 2026 | $2.7B | -12% | -6.2% |
| UNIT Uniti Group | Q2 2026 | $910M | +202% | 3.5% |
| IDT IDT | Q4 FY26 | $339M | +7% | 9.8% |
| TDS Telephone & Data Systems | Q3 2026 | $307M | -0.6% | -9.8% |
| ATNI ATN International | Q3 2026 | $183M | 0% | 7.1% |
| IQST iQSTEL | Q2 2026 | $109M | +51% | -1.0% |
| SHEN Shenandoah Telecommunications | Q3 2026 | $93.9M | +5% | -2.1% |
Source: AT&T 10-Q on SEC EDGAR · CIK 732717 · Telephone Communications (No Radiotelephone)
13F: who owns T and who is buying
More on T
History
Every quarter: Q3 2026 results · Q2 2026 results · Q1 2026 results · Q4 2025 results · Q3 2025 results · Q2 2025 results · Q1 2025 results
- AT&T guidance history: guided vs reported
- AT&T operating margin by quarter
- AT&T net income by quarter
- AT&T free cash flow by quarter
- AT&T capital expenditures by quarter
- AT&T Service revenue by quarter
- AT&T Advanced home internet revenue by quarter
- AT&T Business fiber and advanced connectivity revenue by quarter