Filing Flows › Industrials › Dycom Industries (DY)
Dycom Industries (DY) earnings and revenue breakdown
Latest: Q2 FY27 · 10-Q filed Aug 27, 2026 · Dycom Industries (DY) Q2 FY27 earnings results →
Q2 FY27 Revenue up 46% year over year to $2.0B · 6¢ of every $1 of revenue kept as net profit · operating margin 9.6%
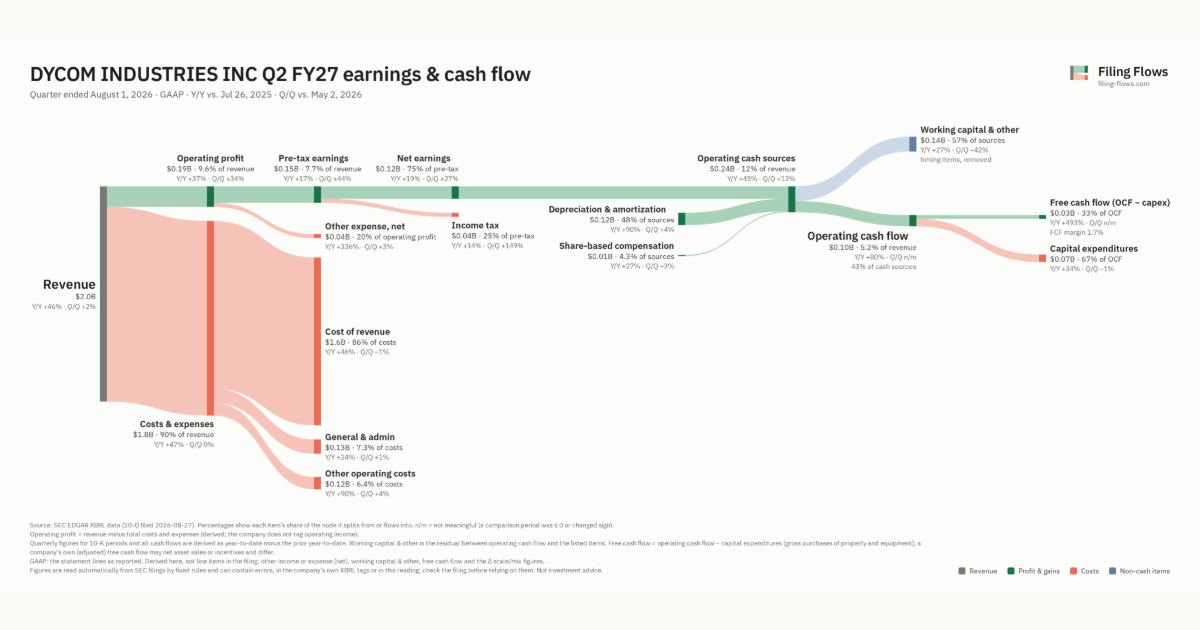
Dycom Industries made $2.0B in Q2 FY27 (+46% Y/Y). Operating margin 9.6%, net earnings $116M. See where every dollar goes — costs, profit and cash — as a Sankey from the 10-Q filed Aug 27, 2026.
Drawing the Sankey…
Open the interactive Sankey → click any line for what the company wrote about it, compare Y/Y and Q/Q, export as PNG or PDF
What changed this quarter
Revenue was $2.0B in Q2 FY27, up 46% year over year and up 2% from the previous quarter.
Operating profit was $0.19B, a 9.6% margin (down 0.6 points year over year). Of the extra revenue versus Q2 FY26, 8% reached operating profit, below the 10% margin then. Total costs grew 47% against revenue growth of 46%. The fastest-growing cost line was Other operating costs (+90%). Net earnings were $0.12B, up 19% year over year. The effective tax rate was 24.9%.
Operating cash flow was $0.10B (up 80% year over year), 90% of net earnings. Non-cash charges added back $0.12B of depreciation and amortization and $0.01B of share-based compensation. Working capital and other items used $0.14B. Capital expenditures of $0.07B left free cash flow of $0.03B.
Quarterly history
| Quarter | Form | Filed | Revenue | Y/Y | Op. margin | Net earnings | Op. cash flow |
|---|---|---|---|---|---|---|---|
| Q2 FY27 | 10-Q | Aug 27, 2026 | $2.0B | +46% | 9.6% | $116M | $104M |
| Q1 FY27 | 10-Q | May 28, 2026 | $2.0B | +56% | 7.3% | $91.3M | −$24.6M |
| Q4 FY26 | 10-K | Mar 9, 2026 | $1.5B | +34% | 3.4% | $16.3M | $419M |
| Q3 FY26 | 10-Q | Nov 20, 2025 | $1.5B | +14% | 10.4% | $106M | $220M |
| Q2 FY26 | 10-Q | Aug 21, 2025 | $1.4B | +14% | 10.1% | $97.5M | $57.4M |
| Q1 FY26 | 10-Q | May 22, 2025 | $1.3B | +10% | 6.8% | $61.0M | −$54.0M |
| Q4 FY25 | 10-K | Feb 28, 2025 | $1.1B | +14% | 4.9% | $32.7M | $328M |
Charts
Interactive views
The same charts as the app — open one to draw it.
💵Where each $1 goesinteractive
Loading the interactive chart…
🌏Named in Asian annual reportsinteractive
Loading the interactive chart…
🔄Rotation against the market and its industry (RRG)interactive
Loading the interactive chart…
🔍Earnings qualityinteractive
Loading the interactive chart…
⚖️Fair value by methodinteractive
Loading the interactive chart…
🔭Outlook & guidanceinteractive
Loading the interactive chart…
📈Investments: gains and what it boughtinteractive
Loading the interactive chart…
🏭Its industry’s money flow (input-output)interactive
Loading the interactive chart…
Customers and suppliers named in filings
Sells to
- T — 25% of its revenue · Stated in 10-K (XBRL) · source
- CHTR — 14% of its revenue · Stated in 10-K (customer table) · source
- VZ — 14% of its revenue · Stated in 10-K (XBRL) · source
- LUMN — 11% of its revenue · Stated in 10-K (XBRL) · source
- CMCSA — 7% of its revenue · Stated in 10-K (customer table) · source
About Dycom Industries
Dycom Industries, Inc. (“Dycom,” the “Company,” “we,” or “us”) is a leading provider of specialty contracting services focused on the digital infrastructure, telecommunications and utilities industries throughout the United States. Since our incorporation in the State of Florida in 1969, we have expanded our scope and service offerings organically and through acquisitions. Today, Dycom is made up of 38 operating companies that serve a diverse customer base across all 50 states from hundreds of field offices. Our deep industry knowledge, strong customer relationships, broad geographic presence and skilled workforce provide the scale needed to quickly execute on opportunities to service existing and new customers throughout urban and rural America.
In its own words, from its 10-K, filed Mar 9, 2026.
Dycom Industries against its Water, Sewer, Pipeline, Comm & Power Line Construction peers
The largest companies of the same SEC industry, each at its latest quarter. Revenue growth: +46% against the peers' median +30%. Operating margin: 9.6% against the peers' median 5.6%.
| Company | Quarter | Revenue | Y/Y | Op. margin |
|---|---|---|---|---|
| DY Dycom Industries | Q2 FY27 | $2.0B | +46% | 9.6% |
| MTZ Mastec | Q3 2026 | $5.2B | +30% | 5.3% |
| PRIM Primoris Services | Q3 2026 | $2.0B | -10% | 4.9% |
| MYRG MYR Group | Q3 2026 | $1.3B | +32% | 6.8% |
| ITG ITG | Q2 2026 | $405M | +38% | 5.6% |
| PLPC Preformed Line Products | Q3 2026 | $210M | +18% | 11.9% |
| ESOA Energy Services of America | Q3 FY26 | $130M | +26% | 3.6% |
Source: Dycom Industries 10-Q on SEC EDGAR · CIK 67215 · Water, Sewer, Pipeline, Comm & Power Line Construction
13F: who owns DY and who is buying
More on DY
History
Every quarter: Q2 FY27 results · Q1 FY27 results · Q4 FY26 results · Q3 FY26 results · Q2 FY26 results · Q1 FY26 results · Q4 FY25 results