Filing Flows › Communication Services › Comcast (CMCSA)
Comcast (CMCSA) earnings and revenue breakdown
Latest: Q3 2026 · 10-Q filed Oct 22, 2026 · Comcast (CMCSA) Q3 2026 earnings results →
Q3 2026 Revenue down 6% year over year to $29.3B · 12¢ of every $1 of revenue kept as net profit · operating margin 18.2%
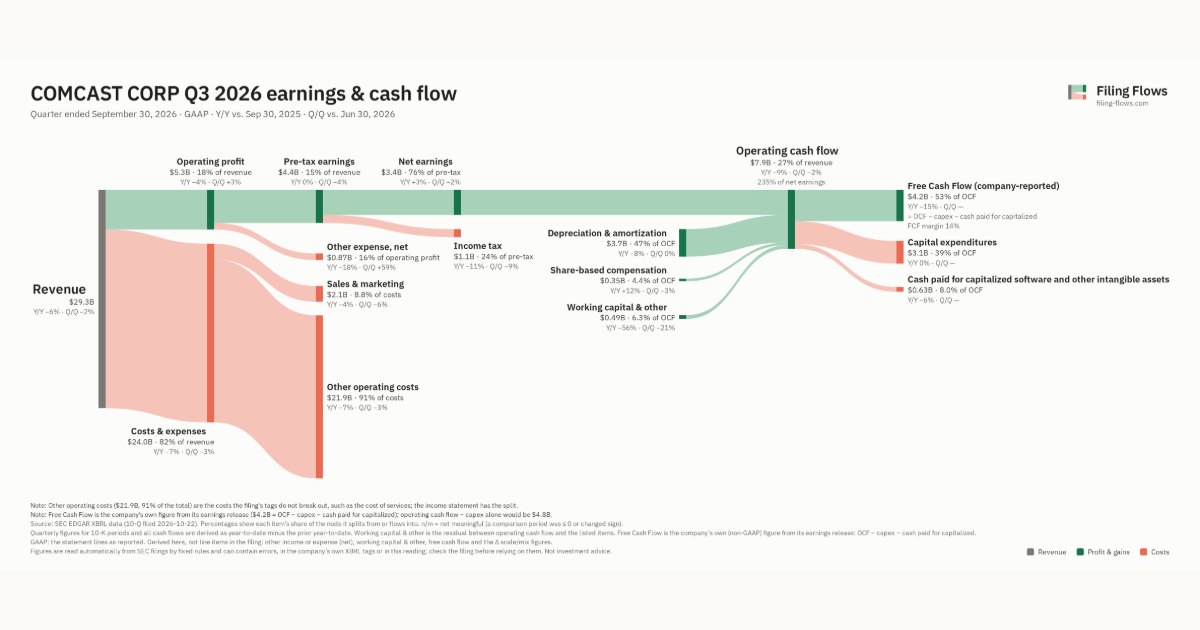
Comcast made $29.3B in Q3 2026 (-6% Y/Y). Operating margin 18.2%, net earnings $3.4B. See where every dollar goes — costs, profit and cash — as a Sankey from the 10-Q filed Oct 22, 2026.
Drawing the Sankey…
Open the interactive Sankey → click any line for what the company wrote about it, compare Y/Y and Q/Q, export as PNG or PDF
What changed this quarter
Revenue was $29.3B in Q3 2026, down 6% year over year and down 2% from the previous quarter.
Operating profit was $5.3B, a 18.2% margin (up 0.4 points year over year). Total costs fell 7% while revenue fell 6%. Net earnings were $3.4B, up 3% year over year ($3.4B including minority interests, which bore $0.09B of losses). The effective tax rate was 24.4%.
Operating cash flow was $7.9B (down 9% year over year), 235% of net income including minority interests. Non-cash charges added back $3.7B of depreciation and amortization and $0.35B of share-based compensation. Working capital and other items added $0.49B. After capital expenditures ($3.1B) and cash paid for capitalized software and other intangible assets ($0.63B), free cash flow as the company reports it was $4.2B.
Quarterly history
| Quarter | Form | Filed | Revenue | Y/Y | Op. margin | Net earnings | Op. cash flow |
|---|---|---|---|---|---|---|---|
| Q3 2026 | 10-Q | Oct 22, 2026 | $29.3B | -6% | 18.2% | $3.4B | $7.9B |
| Q2 2026 | 10-Q | Jul 23, 2026 | $29.9B | -1% | 17.2% | $3.5B | $8.1B |
| Q1 2026 | 10-Q | Apr 23, 2026 | $31.5B | +5% | 13.1% | $2.2B | $6.9B |
| Q4 2025 | 10-K | Feb 3, 2026 | $32.3B | +1% | 10.8% | $2.2B | $8.8B |
| Q3 2025 | 10-Q | Oct 30, 2025 | $31.2B | -3% | 17.7% | $3.3B | $8.7B |
| Q2 2025 | 10-Q | Jul 31, 2025 | $30.3B | +2% | 19.8% | $11.1B | $7.8B |
| Q1 2025 | 10-Q | Apr 24, 2025 | $29.9B | -0.6% | 18.9% | $3.4B | $8.3B |
Charts
Interactive views
The same charts as the app — open one to draw it.
💵Where each $1 goesinteractive
Loading the interactive chart…
🌏Named in Asian annual reportsinteractive
Loading the interactive chart…
🔄Rotation against the market and its industry (RRG)interactive
Loading the interactive chart…
🔍Earnings qualityinteractive
Loading the interactive chart…
⚖️Fair value by methodinteractive
Loading the interactive chart…
🔭Outlook & guidanceinteractive
Loading the interactive chart…
📈Investments: gains and what it boughtinteractive
Loading the interactive chart…
🏭Its industry’s money flow (input-output)interactive
Loading the interactive chart…
Customers and suppliers named in filings
Sells to
Buys from
- VISN — 35% of the supplier’s revenue · Stated in 10-K (XBRL) · source
- UEIC — 12% of the supplier’s revenue · Stated in 10-K (customer table) · source
- VSNT — 11% of the supplier’s revenue · Stated in 10-K (XBRL) · source
- DY — 7% of the supplier’s revenue · Stated in 10-K (customer table) · source
About Comcast
We are a global media and technology company that reaches customers, viewers and guests worldwide through the connectivity and platforms services we provide and the content and experiences we create. We deliver broadband, wireless, video and voice services primarily under the Xfinity, Comcast Business, Sky and NOW brands; produce, distribute and stream leading entertainment, sports and news through brands including NBC, Telemundo, Universal, Peacock and Sky; and own and operate Universal theme parks. • Connectivity & Platforms: Contains our broadband, wireless, video and wireline voice businesses in the United States, United Kingdom and Italy (collectively, the “Connectivity & Platforms markets”). Also includes the operations of our Sky-branded entertainment television networks in the United Kingdom and Italy.
In its own words, from its 10-K, filed Feb 3, 2026.
Comcast against its Cable & Other Pay Television Services peers
The largest companies of the same SEC industry, each at its latest quarter. Revenue growth: -6% against the peers' median -5%. Operating margin: 18.2% against the peers' median 2.7%.
| Company | Quarter | Revenue | Y/Y | Op. margin |
|---|---|---|---|---|
| CMCSA Comcast | Q3 2026 | $29.3B | -6% | 18.2% |
| CHTR Charter Communications | Q3 2026 | $14.9B | +9% | -23.6% |
| WBD Warner Bros. Discovery | Q2 2026 | $8.7B | -11% | 2.7% |
| OPTU Optimum Communications | Q3 2026 | $2.0B | -5% | -152.9% |
| LBTYA Liberty Global | Q3 2026 | $1.9B | +59% | -0.9% |
| ROKU Roku | Q3 2026 | $1.5B | +24% | 10.9% |
| LILA Liberty Latin America | Q3 2026 | $1.1B | +0.4% | 16.2% |
| AMCX AMC Global Media | Q2 2026 | $547M | -9% | 2.9% |
| CABO Cable One | Q3 2026 | $332M | -12% | -103.2% |
Source: Comcast 10-Q on SEC EDGAR · CIK 1166691 · Cable & Other Pay Television Services
Guidance and outlook
13F: who owns CMCSA and who is buying
More on CMCSA
History
Every quarter: Q3 2026 results · Q2 2026 results · Q1 2026 results · Q4 2025 results · Q3 2025 results · Q2 2025 results · Q1 2025 results