Filing Flows › Communication Services › Versant Media Group (VSNT)
Versant Media Group (VSNT) earnings and revenue breakdown
Latest: Q3 2026 · 10-Q filed Nov 3, 2026 · Versant Media Group (VSNT) Q3 2026 earnings results →
Q3 2026 Revenue down 4% year over year to $1.6B · 3¢ of every $1 of revenue kept as net profit · operating margin 6.9%
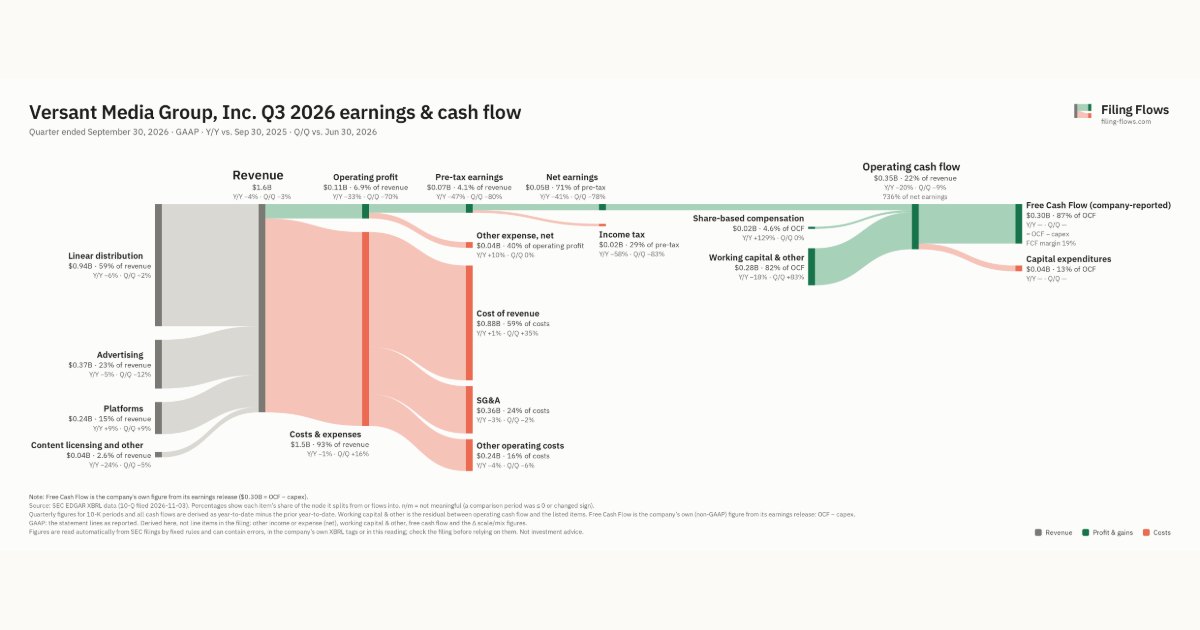
Versant Media Group made $1.6B in Q3 2026 (-4% Y/Y): Linear distribution $935M, Advertising $373M, Platforms $245M. Operating margin 6.9%, net earnings $47.0M. See where every dollar goes — costs, profit and cash — as a Sankey from the 10-Q filed Nov 3, 2026.
Drawing the Sankey…
Open the interactive Sankey → click any line for what the company wrote about it, compare Y/Y and Q/Q, export as PNG or PDF
What changed this quarter
Revenue was $1.6B in Q3 2026, down 4% year over year and down 3% from the previous quarter. Linear distribution was the largest line at 59% of revenue. Linear distribution lost $0.06B year over year (down 6%), 83% of the total change.
Operating profit was $0.11B, a 6.9% margin (down 3.0 points year over year). Total costs fell 1% while revenue fell 4%. Net earnings were $0.05B, down 41% year over year. The effective tax rate was 28.8%.
Operating cash flow was $0.35B (down 20% year over year), 736% of net earnings. Non-cash charges added back $0.02B of share-based compensation. Working capital and other items added $0.28B. After capital expenditures ($0.04B), free cash flow as the company reports it was $0.30B.
Quarterly history
| Quarter | Form | Filed | Revenue | Y/Y | Op. margin | Net earnings | Op. cash flow |
|---|---|---|---|---|---|---|---|
| Q3 2026 | 10-Q | Nov 3, 2026 | $1.6B | -4% | 6.9% | $47.0M | $346M |
| Q2 2026 | 10-Q | Aug 6, 2026 | $1.6B | -4% | 22.3% | $211M | $382M |
| Q1 2026 | 10-Q | May 14, 2026 | $1.7B | -1% | 26.2% | $286M | $585M |
| Q4 2025 | 10-K | Mar 3, 2026 | $1.6B | — | 12.4% | $182M | $476M |
Charts
Interactive views
The same charts as the app — open one to draw it.
💵Where each $1 goesinteractive
Loading the interactive chart…
🌏Named in Asian annual reportsinteractive
Loading the interactive chart…
🔄Rotation against the market and its industry (RRG)interactive
Loading the interactive chart…
🔍Earnings qualityinteractive
Loading the interactive chart…
⚖️Fair value by methodinteractive
Loading the interactive chart…
🔭Outlook & guidanceinteractive
Loading the interactive chart…
📈Investments: gains and what it boughtinteractive
Loading the interactive chart…
🏭Its industry’s money flow (input-output)interactive
Loading the interactive chart…
Customers and suppliers named in filings
Sells to
About Versant Media Group
Versant is a media and entertainment business that operates in four core markets: political news and opinion, business news and personal finance, golf and athletics participation and sports and genre entertainment. We serve these markets primarily through a strong portfolio of brands comprised of television networks operating primarily in the United States, including MS NOW, CNBC, USA Network, Golf Channel, E!, SYFY and Oxygen, and our complementary digital platforms GolfNow, Fandango and Rotten Tomatoes. We produce, license and acquire content that we distribute through a variety of outlets, including our networks and digital platforms, delivering value to key constituents: the viewing audience, paying subscribers, advertisers, distributors and licensing counterparties.
In its own words, from its 10-K, filed Mar 3, 2026.
Versant Media Group against its Television Broadcasting Stations peers
The largest companies of the same SEC industry, each at its latest quarter. Revenue growth: -4% against the peers' median +16%. Operating margin: 6.9% against the peers' median 15.0%.
| Company | Quarter | Revenue | Y/Y | Op. margin |
|---|---|---|---|---|
| VSNT Versant Media Group | Q3 2026 | $1.6B | -4% | 6.9% |
| PSKY Skydance | Q2 2026 | $6.9B | +0.9% | 6.9% |
| FOXA Fox | Q1 FY27 | $4.6B | +22% | 28.1% |
| NXST Nexstar Media Group | Q3 2026 | $2.1B | +78% | 24.9% |
| FWONA Liberty Media | Q3 2026 | $1.2B | +13% | 19.3% |
| GTN Gray Media | Q3 2026 | $972M | +30% | 27.4% |
| SBGI Sinclair | Q3 2026 | $893M | +16% | 15.0% |
| SSP E.W. Scripps | Q3 2026 | $545M | +4% | 12.3% |
| EVC Entravision Communications | Q3 2026 | $226M | +88% | 12.5% |
Source: Versant Media Group 10-Q on SEC EDGAR · CIK 2067876 · Television Broadcasting Stations
Guidance and outlook
13F: who owns VSNT and who is buying
More on VSNT
- How Versant Media Group makes money: revenue by segment
- Versant Media Group next earnings date and what analysts expect
- Versant Media Group stock forecast, price target and fair value
- Who owns Versant Media Group stock: holders, funds and Congress trades
- Versant Media Group guidance and outlook
- Versant Media Group recalls, complaints and regulation
History
Every quarter: Q3 2026 results · Q2 2026 results · Q1 2026 results · Q4 2025 results
- Versant Media Group guidance history: guided vs reported
- Versant Media Group operating margin by quarter
- Versant Media Group net income by quarter
- Versant Media Group free cash flow by quarter
- Versant Media Group capital expenditures by quarter
- Versant Media Group Linear distribution revenue by quarter
- Versant Media Group Advertising revenue by quarter
- Versant Media Group Platforms revenue by quarter