Filing Flows › Communication Services › Roku (ROKU)
Roku (ROKU) earnings and revenue breakdown
Latest: Q3 2026 · 10-Q filed Nov 2, 2026 · Roku (ROKU) Q3 2026 earnings results →
Q3 2026 Revenue up 24% year over year to $1.5B · 12¢ of every $1 of revenue kept as net profit · operating margin 10.9%
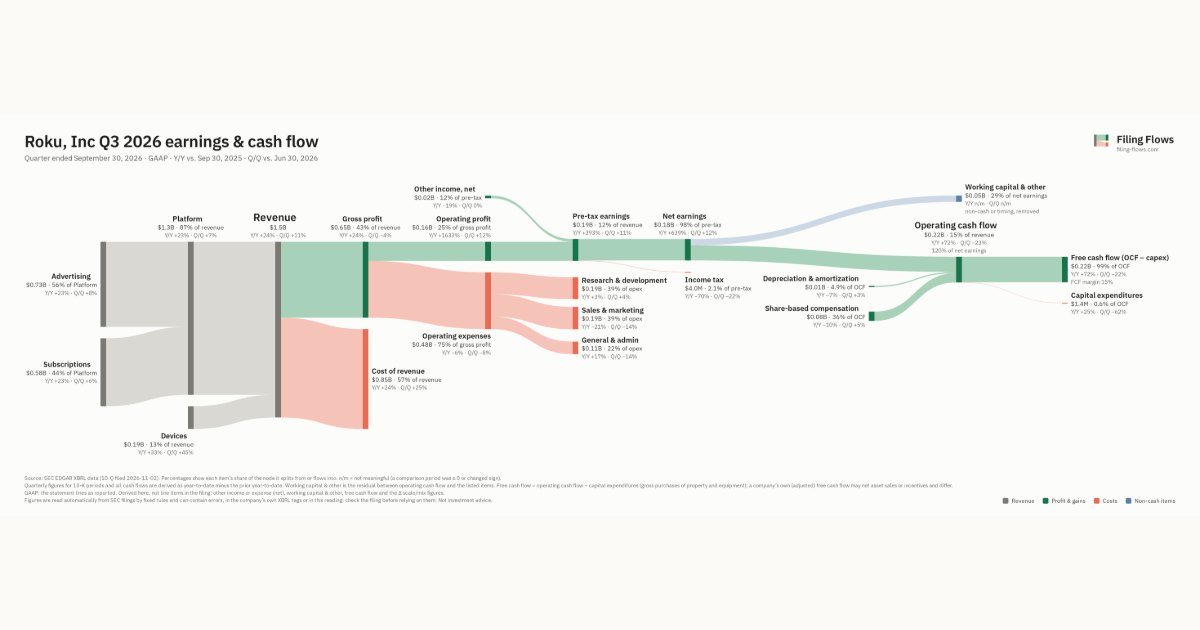
Roku made $1.5B in Q3 2026 (+24% Y/Y): Platform $1.3B, Devices $194M. Operating margin 10.9%, net earnings $183M. See where every dollar goes — costs, profit and cash — as a Sankey from the 10-Q filed Nov 2, 2026.
Drawing the Sankey…
Open the interactive Sankey → click any line for what the company wrote about it, compare Y/Y and Q/Q, export as PNG or PDF
What changed this quarter
Revenue was $1.5B in Q3 2026, up 24% year over year and up 11% from the previous quarter. Advertising was the largest line at 48% of revenue. Advertising added $0.14B year over year (up 23%), 47% of the total change.
Gross margin was 43.2%, down 0.2 points from Q3 2025. Operating profit was $0.16B, a 10.9% margin (up 10.1 points year over year). Of the extra revenue versus Q3 2025, 53% reached operating profit, above the 1% margin then. Operating expenses fell 6% while revenue rose 24%. The fastest-growing cost line was General & admin (+17%). Net earnings were $0.18B, up 639% year over year. The effective tax rate was 2.1%.
Operating cash flow was $0.22B (up 72% year over year), 120% of net earnings. Non-cash charges added back $0.01B of depreciation and amortization and $0.08B of share-based compensation. Working capital and other items used $0.05B. Capital expenditures of $1.4M left free cash flow of $0.22B.
Quarterly history
| Quarter | Form | Filed | Revenue | Y/Y | Op. margin | Net earnings | Op. cash flow |
|---|---|---|---|---|---|---|---|
| Q3 2026 | 10-Q | Nov 2, 2026 | $1.5B | +24% | 10.9% | $183M | $219M |
| Q2 2026 | 10-Q | Aug 6, 2026 | $1.4B | +22% | 10.8% | $164M | $285M |
| Q1 2026 | 10-Q | May 1, 2026 | $1.2B | +22% | 4.1% | $85.7M | $199M |
| Q4 2025 | 10-K | Feb 13, 2026 | $1.4B | +16% | 4.7% | $80.5M | $108M |
| Q3 2025 | 10-Q | Oct 31, 2025 | $1.2B | +14% | 0.8% | $24.8M | $128M |
| Q2 2025 | 10-Q | Aug 1, 2025 | $1.1B | +15% | -2.1% | $10.5M | $110M |
| Q1 2025 | 10-Q | May 2, 2025 | $1.0B | +16% | -5.7% | −$27.4M | $139M |
Charts
Interactive views
The same charts as the app — open one to draw it.
💵Where each $1 goesinteractive
Loading the interactive chart…
🌏Named in Asian annual reportsinteractive
Loading the interactive chart…
🔄Rotation against the market and its industry (RRG)interactive
Loading the interactive chart…
🔍Earnings qualityinteractive
Loading the interactive chart…
⚖️Fair value by methodinteractive
Loading the interactive chart…
🔭Outlook & guidanceinteractive
Loading the interactive chart…
📈Investments: gains and what it boughtinteractive
Loading the interactive chart…
🏭Its industry’s money flow (input-output)interactive
Loading the interactive chart…
Customers and suppliers named in filings
Sells to
- WMT · Stated in 10-K (named, share not stated) · source
- TGT · Stated in 10-K (named, share not stated) · source
- BBY · Stated in 10-K (named, share not stated) · source
- AMZN · Stated in 10-K (named, share not stated) · source
About Roku
Roku, Inc. (“Roku,” the “Company,” “we,” or “us”) is the leading TV streaming platform in the United States, Canada, and Mexico by hours streamed. We pioneered TV streaming and believe that all TV will be streamed. The shift of the TV ecosystem to streaming continues and is expanding TV’s capabilities for viewers, content partners, advertisers, and other industry participants. Nearly every major media company not only has a streaming service, but has also expanded beyond pure subscription streaming models to ad-supported streaming options. Advertisers use TV streaming to reach viewers who are increasingly unreachable on traditional TV, while also benefiting from the digital advertising capabilities that TV streaming platforms can deliver.
In its own words, from its 10-K, filed Feb 13, 2026.
Roku against its Cable & Other Pay Television Services peers
The largest companies of the same SEC industry, each at its latest quarter. Revenue growth: +24% against the peers' median -5%. Operating margin: 10.9% against the peers' median 2.7%.
| Company | Quarter | Revenue | Y/Y | Op. margin |
|---|---|---|---|---|
| ROKU Roku | Q3 2026 | $1.5B | +24% | 10.9% |
| CMCSA Comcast | Q3 2026 | $29.3B | -6% | 18.2% |
| CHTR Charter Communications | Q3 2026 | $14.9B | +9% | -23.6% |
| WBD Warner Bros. Discovery | Q2 2026 | $8.7B | -11% | 2.7% |
| OPTU Optimum Communications | Q3 2026 | $2.0B | -5% | -152.9% |
| LBTYA Liberty Global | Q3 2026 | $1.9B | +59% | -0.9% |
| LILA Liberty Latin America | Q3 2026 | $1.1B | +0.4% | 16.2% |
| AMCX AMC Global Media | Q2 2026 | $547M | -9% | 2.9% |
| CABO Cable One | Q3 2026 | $332M | -12% | -103.2% |
Source: Roku 10-Q on SEC EDGAR · CIK 1428439 · Cable & Other Pay Television Services
Guidance and outlook
13F: who owns ROKU and who is buying
More on ROKU
History
Every quarter: Q3 2026 results · Q2 2026 results · Q1 2026 results · Q4 2025 results · Q3 2025 results · Q2 2025 results · Q1 2025 results