Filing Flows › Consumer Discretionary › Target (TGT)
Target (TGT) earnings and revenue breakdown
Latest: Q2 FY27 · 10-Q filed Aug 28, 2026 · Target (TGT) Q2 FY27 earnings results →
Q2 FY27 Revenue up 5% year over year to $26.5B · 7¢ of every $1 of revenue kept as net profit · operating margin 9.6%
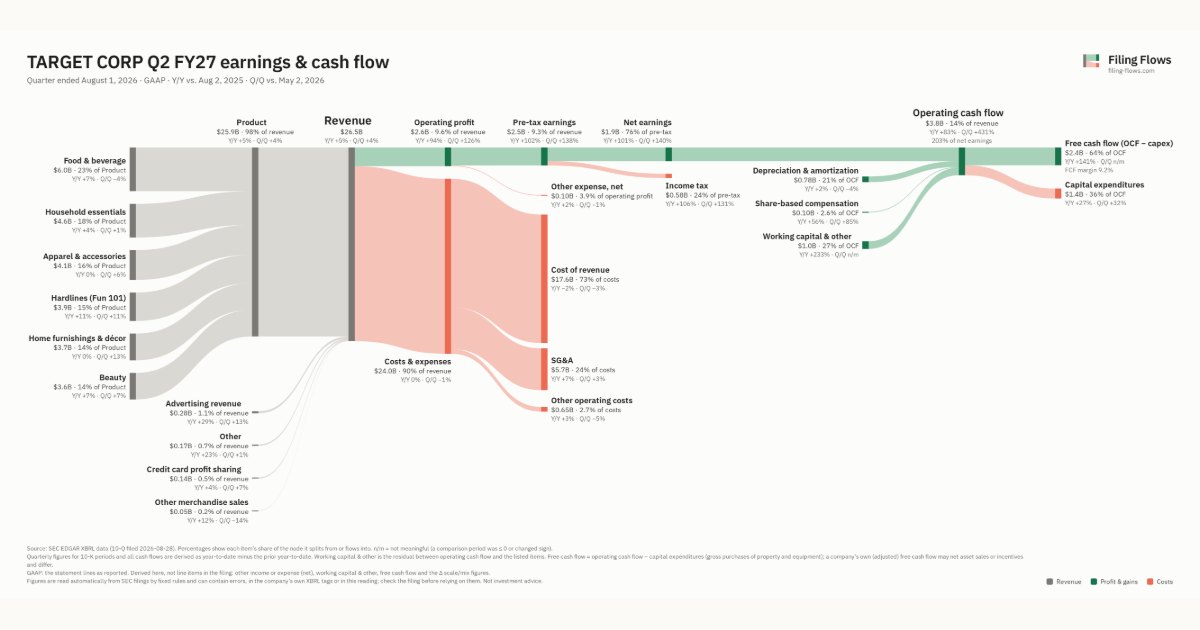
Target made $26.5B in Q2 FY27 (+5% Y/Y): Product $25.9B, Advertising revenue $279M, Other $174M. Operating margin 9.6%, net earnings $1.9B. See where every dollar goes — costs, profit and cash — as a Sankey from the 10-Q filed Aug 28, 2026.
Drawing the Sankey…
Open the interactive Sankey → click any line for what the company wrote about it, compare Y/Y and Q/Q, export as PNG or PDF
What changed this quarter
Revenue was $26.5B in Q2 FY27, up 5% year over year and up 4% from the previous quarter. Food & beverage was the largest line at 23% of revenue. Food & beverage added $0.40B year over year (up 7%), 30% of the total change.
Operating profit was $2.6B, a 9.6% margin (up 4.4 points year over year). Of the extra revenue versus Q2 FY26, 94% reached operating profit, above the 5% margin then. Total costs grew 0% against revenue growth of 5%. Net earnings were $1.9B, up 101% year over year. The effective tax rate was 23.7%.
Operating cash flow was $3.8B (up 83% year over year), 203% of net earnings. Non-cash charges added back $0.78B of depreciation and amortization and $0.10B of share-based compensation. Working capital and other items added $1.0B. Capital expenditures of $1.4B left free cash flow of $2.4B.
Quarterly history
| Quarter | Form | Filed | Revenue | Y/Y | Op. margin | Net earnings | Op. cash flow |
|---|---|---|---|---|---|---|---|
| Q2 FY27 | 10-Q | Aug 28, 2026 | $26.5B | +5% | 9.6% | $1.9B | $3.8B |
| Q1 FY27 | 10-Q | May 29, 2026 | $25.4B | +7% | 4.5% | $781M | $716M |
| Q4 FY26 | 10-K | Mar 11, 2026 | $30.5B | -2% | 4.5% | $1.0B | $3.1B |
| Q3 FY26 | 10-Q | Nov 26, 2025 | $25.3B | -2% | 3.8% | $689M | $1.1B |
| Q2 FY26 | 10-Q | Aug 29, 2025 | $25.2B | -0.9% | 5.2% | $935M | $2.1B |
| Q1 FY26 | 10-Q | May 30, 2025 | $23.8B | -3% | 6.2% | $1.0B | $275M |
| Q4 FY25 | 10-K | Mar 12, 2025 | $30.9B | -3% | 4.7% | $1.1B | $3.3B |
Charts
Interactive views
The same charts as the app — open one to draw it.
💵Where each $1 goesinteractive
Loading the interactive chart…
🌏Named in Asian annual reportsinteractive
Loading the interactive chart…
🔄Rotation against the market and its industry (RRG)interactive
Loading the interactive chart…
🔍Earnings qualityinteractive
Loading the interactive chart…
⚖️Fair value by methodinteractive
Loading the interactive chart…
🔭Outlook & guidanceinteractive
Loading the interactive chart…
📈Investments: gains and what it boughtinteractive
Loading the interactive chart…
🏭Its industry’s money flow (input-output)interactive
Loading the interactive chart…
Customers and suppliers named in filings
Sells to
- MLM · Stated in 10-K (named, share not stated) · source
- KTB · Stated in 10-K (named, share not stated) · source
Buys from
- HNST — 28% of the supplier’s revenue · Stated in 10-K (sentence) · source
- JAKK — 26% of the supplier’s revenue · Stated in 10-K (sentence) · source
- ELF — 18% of the supplier’s revenue · Stated in 10-K (customer table) · source
- JBSS — 12% of the supplier’s revenue · Stated in 10-K (sentence) · source
- HELE — 12% of the supplier’s revenue · Stated in 10-K (sentence) · source
- EPC — 9% of the supplier’s revenue · Stated in 10-K (sentence) · source
- ROKU · Stated in 10-K (named, share not stated) · source
- MAT · Stated in 10-K (named, share not stated) · source
About Target
Target Corporation was incorporated in Minnesota in 1902. Our corporate purpose is to help all families discover the joy of everyday life. We offer our customers, referred to as "guests," fashionable, differentiated merchandise and everyday essentials at discounted prices. We operate as a single segment designed to enable guests to purchase products seamlessly in stores or through our digital channels. Since 1946, we have given 5 percent of our profit to communities. When used in this report, the terms "we," "our," "us," "Target," and the "Corporation" mean Target Corporation and its subsidiaries, collectively, unless the context otherwise requires or indicates.
In its own words, from its 10-K, filed Mar 11, 2026.
Target against its Retail-Variety Stores peers
The largest companies of the same SEC industry, each at its latest quarter. Revenue growth: +5% against the peers' median +9%. Operating margin: 9.6% against the peers' median 6.8%.
| Company | Quarter | Revenue | Y/Y | Op. margin |
|---|---|---|---|---|
| TGT Target | Q2 FY27 | $26.5B | +5% | 9.6% |
| WMT Walmart | Q2 FY27 | $187.9B | +6% | 5.0% |
| COST Costco Wholesale | Q4 FY26 | $95.7B | +11% | 4.0% |
| DG Dollar General | Q2 FY27 | $11.3B | +5% | 6.8% |
| BJ BJ's Wholesale Club Holdings | Q2 FY27 | $6.2B | +16% | 4.1% |
| DLTR Dollar Tree | Q2 FY27 | $4.9B | +7% | 14.1% |
| PSMT Pricesmart | Q4 FY26 | $1.5B | +14% | 3.8% |
| FIVE Five Below | Q2 FY27 | $1.3B | +23% | 21.8% |
| OLLI Ollie's Bargain Outlet Holdings | Q2 FY27 | $741M | +9% | 14.6% |
Source: Target 10-Q on SEC EDGAR · CIK 27419 · Retail-Variety Stores
Guidance and outlook
13F: who owns TGT and who is buying
More on TGT
- How Target makes money: revenue by segment
- Target next earnings date and what analysts expect
- Target stock forecast, price target and fair value
- Who owns Target stock: holders, funds and Congress trades
- Target guidance and outlook
- Is Target a takeover target? LBO and rumors
- Target recalls, complaints and regulation
History
Every quarter: Q2 FY27 results · Q1 FY27 results · Q4 FY26 results · Q3 FY26 results · Q2 FY26 results · Q1 FY26 results · Q4 FY25 results