Filing Flows › Consumer Discretionary › Dollar Tree (DLTR)
Dollar Tree (DLTR) earnings and revenue breakdown
Latest: Q2 FY27 · 10-Q filed Aug 27, 2026 · Dollar Tree (DLTR) Q2 FY27 earnings results →
Q2 FY27 Revenue up 7% year over year to $4.9B · 11¢ of every $1 of revenue kept as net profit · operating margin 14.1%
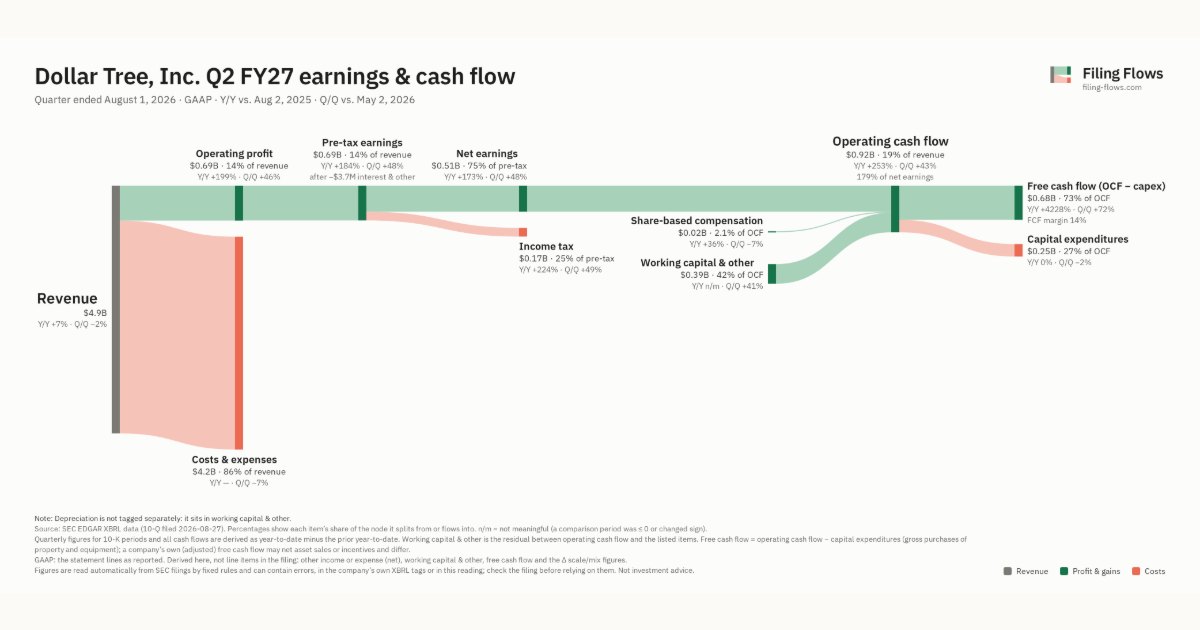
Dollar Tree made $4.9B in Q2 FY27 (+7% Y/Y). Operating margin 14.1%, net earnings $514M. See where every dollar goes — costs, profit and cash — as a Sankey from the 10-Q filed Aug 27, 2026.
Drawing the Sankey…
Open the interactive Sankey → click any line for what the company wrote about it, compare Y/Y and Q/Q, export as PNG or PDF
What changed this quarter
Revenue was $4.9B in Q2 FY27, up 7% year over year and down 2% from the previous quarter.
Operating profit was $0.69B, a 14.1% margin (up 9.1 points year over year). Of the extra revenue versus Q2 FY26, 143% reached operating profit, above the 5% margin then. Net earnings were $0.51B, up 173% year over year. The effective tax rate was 25.0%.
Operating cash flow was $0.92B (up 253% year over year), 179% of net earnings. Non-cash charges added back $0.02B of share-based compensation. Working capital and other items added $0.39B. Capital expenditures of $0.25B left free cash flow of $0.68B.
Quarterly history
| Quarter | Form | Filed | Revenue | Y/Y | Op. margin | Net earnings | Op. cash flow |
|---|---|---|---|---|---|---|---|
| Q2 FY27 | 10-Q | Aug 27, 2026 | $4.9B | +7% | 14.1% | $514M | $922M |
| Q1 FY27 | 10-Q | May 28, 2026 | $5.0B | +7% | 9.5% | $347M | $644M |
| Q4 FY26 | 10-K | Mar 16, 2026 | $5.5B | +9% | 12.7% | $506M | $1.2B |
| Q3 FY26 | 10-Q | Dec 3, 2025 | $4.8B | +9% | 7.2% | $245M | $319M |
| Q2 FY26 | 10-Q | Sep 3, 2025 | $4.6B | +12% | 5.1% | $188M | $261M |
| Q1 FY26 | 10-Q | Jun 4, 2025 | $4.6B | +11% | 8.3% | $343M | $378M |
Charts
Interactive views
The same charts as the app — open one to draw it.
💵Where each $1 goesinteractive
Loading the interactive chart…
🌏Named in Asian annual reportsinteractive
Loading the interactive chart…
🔄Rotation against the market and its industry (RRG)interactive
Loading the interactive chart…
🔍Earnings qualityinteractive
Loading the interactive chart…
⚖️Fair value by methodinteractive
Loading the interactive chart…
🔭Outlook & guidanceinteractive
Loading the interactive chart…
📈Investments: gains and what it boughtinteractive
Loading the interactive chart…
🏭Its industry’s money flow (input-output)interactive
Loading the interactive chart…
Customers and suppliers named in filings
Buys from
About Dollar Tree
We are a leading operator of retail discount stores operating under the brand names of Dollar Tree and Dollar Tree Canada. At January 31, 2026, we operated approximately 9,000 stores across 48 states and the District of Columbia and approximately 275 stores across seven Canadian provinces. We believe the convenience and value we offer, as well as the “thrill-of-the-hunt” shopping experience where customers discover new celebratory and seasonal items every week, are key factors in serving and growing our base of loyal customers. We continue to execute on a number of strategic initiatives across our business to drive profitable growth for Dollar Tree as a standalone banner following the sale of Family Dollar.
In its own words, from its 10-K, filed Mar 16, 2026.
Dollar Tree against its Retail-Variety Stores peers
The largest companies of the same SEC industry, each at its latest quarter. Revenue growth: +7% against the peers' median +9%. Operating margin: 14.1% against the peers' median 6.8%.
| Company | Quarter | Revenue | Y/Y | Op. margin |
|---|---|---|---|---|
| DLTR Dollar Tree | Q2 FY27 | $4.9B | +7% | 14.1% |
| WMT Walmart | Q2 FY27 | $187.9B | +6% | 5.0% |
| COST Costco Wholesale | Q4 FY26 | $95.7B | +11% | 4.0% |
| TGT Target | Q2 FY27 | $26.5B | +5% | 9.6% |
| DG Dollar General | Q2 FY27 | $11.3B | +5% | 6.8% |
| BJ BJ's Wholesale Club Holdings | Q2 FY27 | $6.2B | +16% | 4.1% |
| PSMT Pricesmart | Q4 FY26 | $1.5B | +14% | 3.8% |
| FIVE Five Below | Q2 FY27 | $1.3B | +23% | 21.8% |
| OLLI Ollie's Bargain Outlet Holdings | Q2 FY27 | $741M | +9% | 14.6% |
Source: Dollar Tree 10-Q on SEC EDGAR · CIK 935703 · Retail-Variety Stores
Guidance and outlook
13F: who owns DLTR and who is buying
More on DLTR
- How Dollar Tree makes money: revenue by segment
- Dollar Tree next earnings date and what analysts expect
- Dollar Tree stock forecast, price target and fair value
- Who owns Dollar Tree stock: holders, funds and Congress trades
- Is Dollar Tree a takeover target? LBO and rumors
- Dollar Tree recalls, complaints and regulation
History
Every quarter: Q2 FY27 results · Q1 FY27 results · Q4 FY26 results · Q3 FY26 results · Q2 FY26 results · Q1 FY26 results