Filing Flows › Consumer Discretionary › Five Below (FIVE)
Five Below (FIVE) earnings and revenue breakdown
Latest: Q2 FY27 · 10-Q filed Sep 3, 2026 · Five Below (FIVE) Q2 FY27 earnings results →
Q2 FY27 Revenue up 23% year over year to $1.3B · 18¢ of every $1 of revenue kept as net profit · operating margin 21.8%
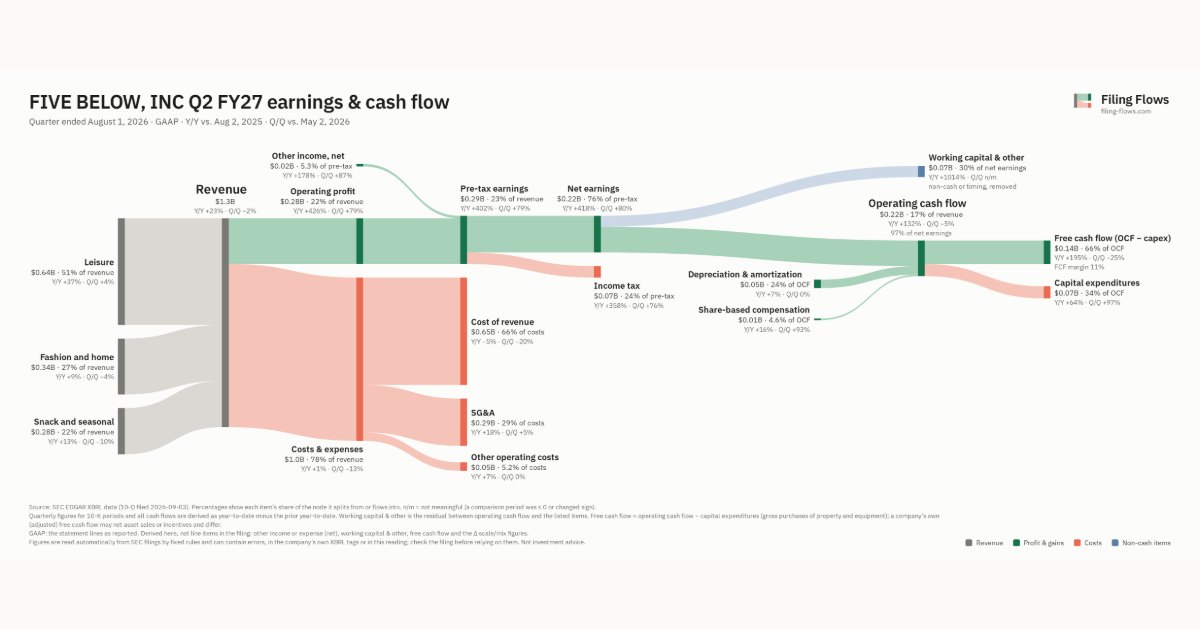
Five Below made $1.3B in Q2 FY27 (+23% Y/Y): Leisure $644M, Fashion and home $338M, Snack and seasonal $280M. Operating margin 21.8%, net earnings $221M. See where every dollar goes — costs, profit and cash — as a Sankey from the 10-Q filed Sep 3, 2026.
Drawing the Sankey…
Open the interactive Sankey → click any line for what the company wrote about it, compare Y/Y and Q/Q, export as PNG or PDF
What changed this quarter
Revenue was $1.3B in Q2 FY27, up 23% year over year and down 2% from the previous quarter. Leisure was the largest line at 51% of revenue. Leisure added $0.17B year over year (up 37%), 74% of the total change.
Operating profit was $0.28B, a 21.8% margin (up 16.7 points year over year). Of the extra revenue versus Q2 FY26, 95% reached operating profit, above the 5% margin then. Total costs grew 1% against revenue growth of 23%. The fastest-growing cost line was SG&A (+18%). Net earnings were $0.22B, up 418% year over year. The effective tax rate was 23.9%.
Operating cash flow was $0.22B (up 132% year over year), 97% of net earnings. Non-cash charges added back $0.05B of depreciation and amortization and $0.01B of share-based compensation. Working capital and other items used $0.07B. Capital expenditures of $0.07B left free cash flow of $0.14B.
Quarterly history
| Quarter | Form | Filed | Revenue | Y/Y | Op. margin | Net earnings | Op. cash flow |
|---|---|---|---|---|---|---|---|
| Q2 FY27 | 10-Q | Sep 3, 2026 | $1.3B | +23% | 21.8% | $221M | $215M |
| Q1 FY27 | 10-Q | Jun 4, 2026 | $1.3B | +32% | 12.0% | $123M | $227M |
| Q4 FY26 | 10-K | Mar 19, 2026 | $1.7B | +24% | 18.0% | $238M | $441M |
| Q3 FY26 | 10-Q | Dec 4, 2025 | $1.0B | +23% | 4.2% | $36.5M | −$80.1M |
| Q2 FY26 | 10-Q | Aug 28, 2025 | $1.0B | +24% | 5.1% | $42.8M | $93.0M |
| Q1 FY26 | 10-Q | Jun 5, 2025 | $971M | +20% | 5.2% | $41.1M | $133M |
| Q4 FY25 | 10-K | Mar 20, 2025 | $1.4B | +4% | 17.7% | $187M | $364M |
Charts
Interactive views
The same charts as the app — open one to draw it.
💵Where each $1 goesinteractive
Loading the interactive chart…
🌏Named in Asian annual reportsinteractive
Loading the interactive chart…
🔄Rotation against the market and its industry (RRG)interactive
Loading the interactive chart…
🔍Earnings qualityinteractive
Loading the interactive chart…
⚖️Fair value by methodinteractive
Loading the interactive chart…
🔭Outlook & guidanceinteractive
Loading the interactive chart…
📈Investments: gains and what it boughtinteractive
Loading the interactive chart…
🏭Its industry’s money flow (input-output)interactive
Loading the interactive chart…
About Five Below
Five Below, Inc. was incorporated in Pennsylvania in January 2002. Our principal executive office is located at 701 Market Street, Suite 300, Philadelphia, PA 19106 and our telephone number is (215) 546-7909. Our corporate website address is www.fivebelow.com . The information contained on, or accessible through, our corporate website does not constitute part of this Annual Report. As used herein, “Five Below,” the “Company,” “we,” “us,” “our” or “our business” refers to Five Below, Inc. (collectively with its wholly owned subsidiaries), except as expressly indicated or unless the context otherwise requires. As used herein, references to “crew” refers to our employees, and references to “shipcenters” refers to our distribution and logistics centers.
In its own words, from its 10-K, filed Mar 19, 2026.
Five Below against its Retail-Variety Stores peers
The largest companies of the same SEC industry, each at its latest quarter. Revenue growth: +23% against the peers' median +9%. Operating margin: 21.8% against the peers' median 6.8%.
| Company | Quarter | Revenue | Y/Y | Op. margin |
|---|---|---|---|---|
| FIVE Five Below | Q2 FY27 | $1.3B | +23% | 21.8% |
| WMT Walmart | Q2 FY27 | $187.9B | +6% | 5.0% |
| COST Costco Wholesale | Q4 FY26 | $95.7B | +11% | 4.0% |
| TGT Target | Q2 FY27 | $26.5B | +5% | 9.6% |
| DG Dollar General | Q2 FY27 | $11.3B | +5% | 6.8% |
| BJ BJ's Wholesale Club Holdings | Q2 FY27 | $6.2B | +16% | 4.1% |
| DLTR Dollar Tree | Q2 FY27 | $4.9B | +7% | 14.1% |
| PSMT Pricesmart | Q4 FY26 | $1.5B | +14% | 3.8% |
| OLLI Ollie's Bargain Outlet Holdings | Q2 FY27 | $741M | +9% | 14.6% |
Source: Five Below 10-Q on SEC EDGAR · CIK 1177609 · Retail-Variety Stores
Guidance and outlook
13F: who owns FIVE and who is buying
More on FIVE
History
Every quarter: Q2 FY27 results · Q1 FY27 results · Q4 FY26 results · Q3 FY26 results · Q2 FY26 results · Q1 FY26 results · Q4 FY25 results
- Five Below guidance history: guided vs reported
- Five Below operating margin by quarter
- Five Below net income by quarter
- Five Below free cash flow by quarter
- Five Below capital expenditures by quarter
- Five Below Leisure revenue by quarter
- Five Below Fashion and home revenue by quarter
- Five Below Snack and seasonal revenue by quarter