Filing Flows › Communication Services › AST SpaceMobile (ASTS)
AST SpaceMobile (ASTS) earnings and revenue breakdown
Latest: Q2 2026 · 10-Q filed Aug 10, 2026 · AST SpaceMobile (ASTS) Q2 2026 earnings results →
Q2 2026 Revenue up 2627% year over year to $31.5M · 952¢ of every $1 of revenue lost · operating margin -948.0%
AST SpaceMobile made $31.5M in Q2 2026 (27× Y/Y): Product $24.4M, Service $7.1M. Operating margin -948.0%, net loss $300M. See where every dollar goes — costs, profit and cash — as a Sankey from the 10-Q filed Aug 10, 2026.
Drawing the Sankey…
Open the interactive Sankey → click any line for what the company wrote about it, compare Y/Y and Q/Q, export as PNG or PDF
What changed this quarter
Revenue was $31.5M in Q2 2026, up 2627% year over year and up 114% from the previous quarter. Product was the largest line at 78% of revenue. Product added $24.4M year over year (up 48756%), 80% of the total change.
Operating costs exceeded revenue by $298.8M, an operating margin of -948.0%. Total costs grew 142% against revenue growth of 2627%. The fastest-growing cost line was Other operating costs (+152%). The quarter ended with a net loss of $299.9M, wider than the previous quarter's $249.6M loss. Minority interests bore $69.0M of it: to shareholders the quarter was a loss of $230.9M.
Operating cash flow was −$97.2M. Non-cash charges added back $20.7M of depreciation and amortization and $63.5M of share-based compensation. Working capital and other items added $118.6M. Capital expenditures of $597.6M exceeded it, leaving free cash flow of −$694.8M.
Quarterly history
| Quarter | Form | Filed | Revenue | Y/Y | Op. margin | Net earnings | Op. cash flow |
|---|---|---|---|---|---|---|---|
| Q2 2026 | 10-Q | Aug 10, 2026 | $31.5M | 27× | -948.0% | −$300M | −$97.2M |
| Q1 2026 | 10-Q | May 11, 2026 | $14.7M | 21× | n/m | −$250M | −$48.1M |
| Q4 2025 | 10-K | Mar 2, 2026 | $54.3M | 29× | -175.0% | −$97.7M | $65.0M |
| Q3 2025 | 10-Q | Nov 10, 2025 | $14.7M | 13× | n/m | −$164M | −$64.5M |
| Q2 2025 | 10-Q | Aug 11, 2025 | $1.2M | +28% | n/m | −$136M | −$43.5M |
| Q1 2025 | 10-Q | May 12, 2025 | $718K | +44% | n/m | −$63.6M | −$28.5M |
| Q4 2024 | 10-K | Mar 3, 2025 | $1.9M | — | n/m | −$52.1M | −$28.4M |
Charts
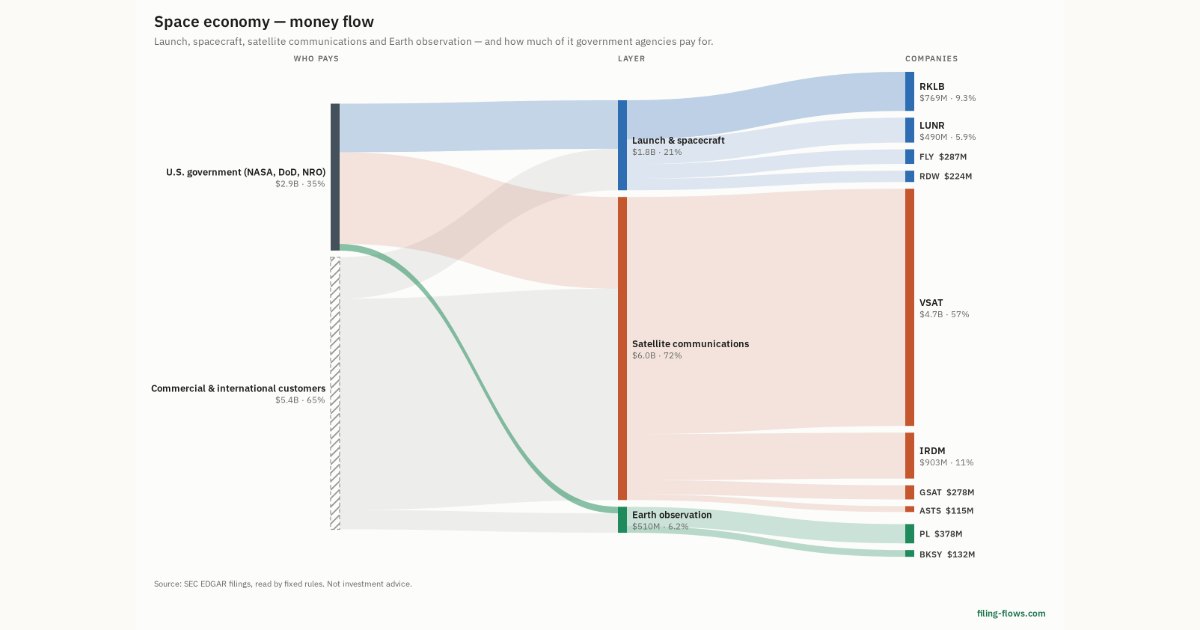
In supply chains and themes
Interactive views
The same charts as the app — open one to draw it.
💵Where each $1 goesinteractive
Loading the interactive chart…
🌏Named in Asian annual reportsinteractive
Loading the interactive chart…
🔄Rotation against the market and its industry (RRG)interactive
Loading the interactive chart…
🔍Earnings qualityinteractive
Loading the interactive chart…
⚖️Fair value by methodinteractive
Loading the interactive chart…
🔭Outlook & guidanceinteractive
Loading the interactive chart…
📈Investments: gains and what it boughtinteractive
Loading the interactive chart…
🏭Its industry’s money flow (input-output)interactive
Loading the interactive chart…
About AST SpaceMobile
We are building the first and only global Cellular Broadband network in space to be accessible directly by everyday smartphones (2G/4G-LTE/5G devices) for commercial use, and for other applications for government use utilizing our extensive intellectual property (“IP”) and patent portfolio. The SpaceMobile Service is being designed to provide cost-effective, high-speed Cellular Broadband services to end-users who are out of terrestrial cellular coverage using existing mobile devices. The SpaceMobile Service currently is planned to be provided by a constellation of high-powered, large phased-array satellites in LEO using low-band and mid-band spectrum controlled by MNOs.
In its own words, from its 10-K, filed Mar 2, 2026.
AST SpaceMobile against its Communications Services, NEC peers
The largest companies of the same SEC industry, each at its latest quarter. Revenue growth: 27× against the peers' median +3%. Operating margin: -948.0% against the peers' median 5.5%.
| Company | Quarter | Revenue | Y/Y | Op. margin |
|---|---|---|---|---|
| ASTS AST SpaceMobile | Q2 2026 | $31.5M | 27× | -948.0% |
| VSAT Viasat | Q2 FY27 | $1.2B | +3% | 0.6% |
| ECHO EchoStar | Q3 2026 | $1.1B | -69% | 13.1% |
| CALX Calix | Q3 2026 | $302M | +14% | 5.5% |
| IRDM Iridium Communications | Q3 2026 | $246M | +8% | 12.9% |
| CCOI Cogent Communications Holdings | Q3 2026 | $231M | -4% | -3.0% |
| GOGO Gogo | Q3 2026 | $213M | -5% | 8.0% |
| GSAT Globalstar | Q3 2026 | $70.9M | -4% | 10.7% |
| KVHI KVH Industries | Q3 2026 | $38.4M | +35% | -3.2% |
Source: AST SpaceMobile 10-Q on SEC EDGAR · CIK 1780312 · Communications Services, NEC
Guidance and outlook
13F: who owns ASTS and who is buying
More on ASTS
History
Every quarter: Q2 2026 results · Q1 2026 results · Q4 2025 results · Q3 2025 results · Q2 2025 results · Q1 2025 results · Q4 2024 results