Filing Flows › Communication Services › Viasat (VSAT)
Viasat (VSAT) earnings and revenue breakdown
Latest: Q2 FY27 · 10-Q filed Nov 6, 2026 · Viasat (VSAT) Q2 FY27 earnings results →
Q2 FY27 Revenue up 3% year over year to $1.2B · 10¢ of every $1 of revenue lost · operating margin 0.6%
Viasat made $1.2B in Q2 FY27 (+3% Y/Y): Service $821M, Product $359M. Operating margin 0.6%, net loss $120M. See where every dollar goes — costs, profit and cash — as a Sankey from the 10-Q filed Nov 6, 2026.
Drawing the Sankey…
Open the interactive Sankey → click any line for what the company wrote about it, compare Y/Y and Q/Q, export as PNG or PDF
What changed this quarter
Revenue was $1.2B in Q2 FY27, up 3% year over year and up 2% from the previous quarter. Service was the largest line at 70% of revenue. Product added $0.04B year over year (up 13%), 102% of the total change.
Operating profit was $0.01B, a 0.6% margin (down 2.5 points year over year). Operating profit fell $0.03B even though revenue rose $0.04B versus Q2 FY26, so costs grew faster than sales. Total costs grew 6% against revenue growth of 3%. The fastest-growing cost line was Research & development (+41%). The quarter ended with a net loss of $0.12B, wider than the previous quarter's $0.04B loss. Net interest and other expense of $0.09B was the main reason.
Operating cash flow was $0.28B (up 1% year over year). Non-cash charges added back $0.33B of depreciation and amortization and $0.03B of share-based compensation. Working capital and other items added $0.04B.
Quarterly history
| Quarter | Form | Filed | Revenue | Y/Y | Op. margin | Net earnings | Op. cash flow |
|---|---|---|---|---|---|---|---|
| Q2 FY27 | 10-Q | Nov 6, 2026 | $1.2B | +3% | 0.6% | −$120M | $285M |
| Q1 FY27 | 10-Q | Aug 6, 2026 | $1.2B | -1% | 4.1% | −$42.8M | $261M |
| Q4 FY26 | 10-K | May 29, 2026 | $1.2B | +2% | -0.1% | $66.0M | $322M |
| Q3 FY26 | 10-Q | Feb 6, 2026 | $1.2B | +3% | 2.3% | $25.0M | $727M |
| Q2 FY26 | 10-Q | Nov 10, 2025 | $1.1B | +2% | 3.1% | −$51.8M | $282M |
| Q1 FY26 | 10-Q | Aug 8, 2025 | $1.2B | +4% | 4.0% | −$47.7M | $258M |
| Q4 FY25 | 10-K | May 27, 2025 | $1.1B | -0.3% | -13.4% | −$241M | $298M |
Charts
In supply chains and themes
Interactive views
The same charts as the app — open one to draw it.
💵Where each $1 goesinteractive
Loading the interactive chart…
🌏Named in Asian annual reportsinteractive
Loading the interactive chart…
🔄Rotation against the market and its industry (RRG)interactive
Loading the interactive chart…
🔍Earnings qualityinteractive
Loading the interactive chart…
⚖️Fair value by methodinteractive
Loading the interactive chart…
🔭Outlook & guidanceinteractive
Loading the interactive chart…
📈Investments: gains and what it boughtinteractive
Loading the interactive chart…
🏭Its industry’s money flow (input-output)interactive
Loading the interactive chart…
Customers and suppliers named in filings
Sells to
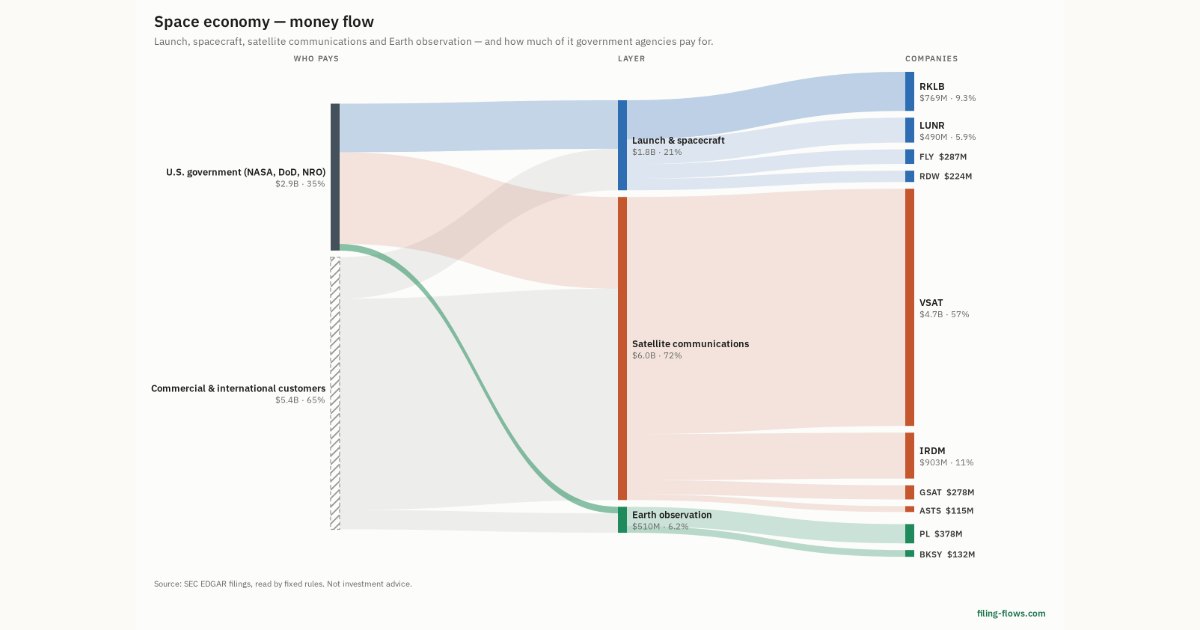
- U.S. government — 16% of its revenue · Stated in 10-K (sentence) · source
About Viasat
Viasat is a global communications company that believes everyone and everything in the world can be connected. With offices in 24 countries around the world, our mission shapes how consumers, businesses, governments and militaries around the world communicate and connect. Viasat is developing the ultimate global communications network to power high-quality, reliable, secure, affordable, fast connections to positively impact people’s lives anywhere they are—on the ground, in the air or at sea, while building a sustainable future in space. In May 2023, Viasat completed its acquisition of Inmarsat, combining the teams, technologies and resources of the two companies to create a new global communications partner. Learn more at www.viasat.com , the Viasat News Room or follow us on LinkedIn , X , Instagram , Facebook , Bluesky , Threads , and YouTube .
In its own words, from its 8-K, filed Aug 4, 2026.
Viasat against its Communications Services, NEC peers
The largest companies of the same SEC industry, each at its latest quarter. Revenue growth: +3% against the peers' median +3%. Operating margin: 0.6% against the peers' median 5.5%.
| Company | Quarter | Revenue | Y/Y | Op. margin |
|---|---|---|---|---|
| VSAT Viasat | Q2 FY27 | $1.2B | +3% | 0.6% |
| ECHO EchoStar | Q3 2026 | $1.1B | -69% | 13.1% |
| CALX Calix | Q3 2026 | $302M | +14% | 5.5% |
| IRDM Iridium Communications | Q3 2026 | $246M | +8% | 12.9% |
| CCOI Cogent Communications Holdings | Q3 2026 | $231M | -4% | -3.0% |
| GOGO Gogo | Q3 2026 | $213M | -5% | 8.0% |
| GSAT Globalstar | Q3 2026 | $70.9M | -4% | 10.7% |
| KVHI KVH Industries | Q3 2026 | $38.4M | +35% | -3.2% |
| ASTS AST SpaceMobile | Q2 2026 | $31.5M | 27× | -948.0% |
Source: Viasat 10-Q on SEC EDGAR · CIK 797721 · Communications Services, NEC
Guidance and outlook
13F: who owns VSAT and who is buying
More on VSAT
- How Viasat makes money: revenue by segment
- Viasat next earnings date and what analysts expect
- Viasat stock forecast, price target and fair value
- Who owns Viasat stock: holders, funds and Congress trades
- Viasat guidance and outlook
- Is Viasat a takeover target? LBO and rumors
- Viasat recalls, complaints and regulation
History
Every quarter: Q2 FY27 results · Q1 FY27 results · Q4 FY26 results · Q3 FY26 results · Q2 FY26 results · Q1 FY26 results · Q4 FY25 results